
Stop-Loss Hunting: Meaning, Pattern and How to Spot It
What stop-loss hunting means
Every trader who sells places a stop-loss a little above a recent high. Every trader who buys places one a little below a recent low. So the price just beyond an obvious high or low is a place where many orders are waiting.
Stop-loss hunting is what traders call it when price moves to that place, triggers those waiting orders, and then either reverses or keeps running. A stop-loss on a short position is a buy order. When many of them trigger together, they push price up quickly. The same thing happens in reverse below a low.
Nobody outside the exchange can see the stop-loss orders themselves. What you can see is where they are likely to be, because traders place them in predictable spots.
How the pattern builds
The pattern has a build-up and a trigger. The build-up can take hours. The trigger is usually one candle.
Take the selling side. Price makes a high and falls. It bounces, but stops at a lower high and falls again. Then another lower high. Each of those highs is a place where sellers stepped in, and each has their stop-losses resting just above it. Join the highs and you get a falling trendline. The mirror image is buyers stepping in at higher and higher lows, with their stops below each one.
- Three or more lower highs in a row: sellers in control, stops stacked above each high
- Three or more higher lows in a row: buyers in control, stops stacked below each low
- The trigger: a candle closes back through the most recent high or low
- After the trigger, the earlier highs or lows become the next levels price may run to
A real example: Tata Elxsi
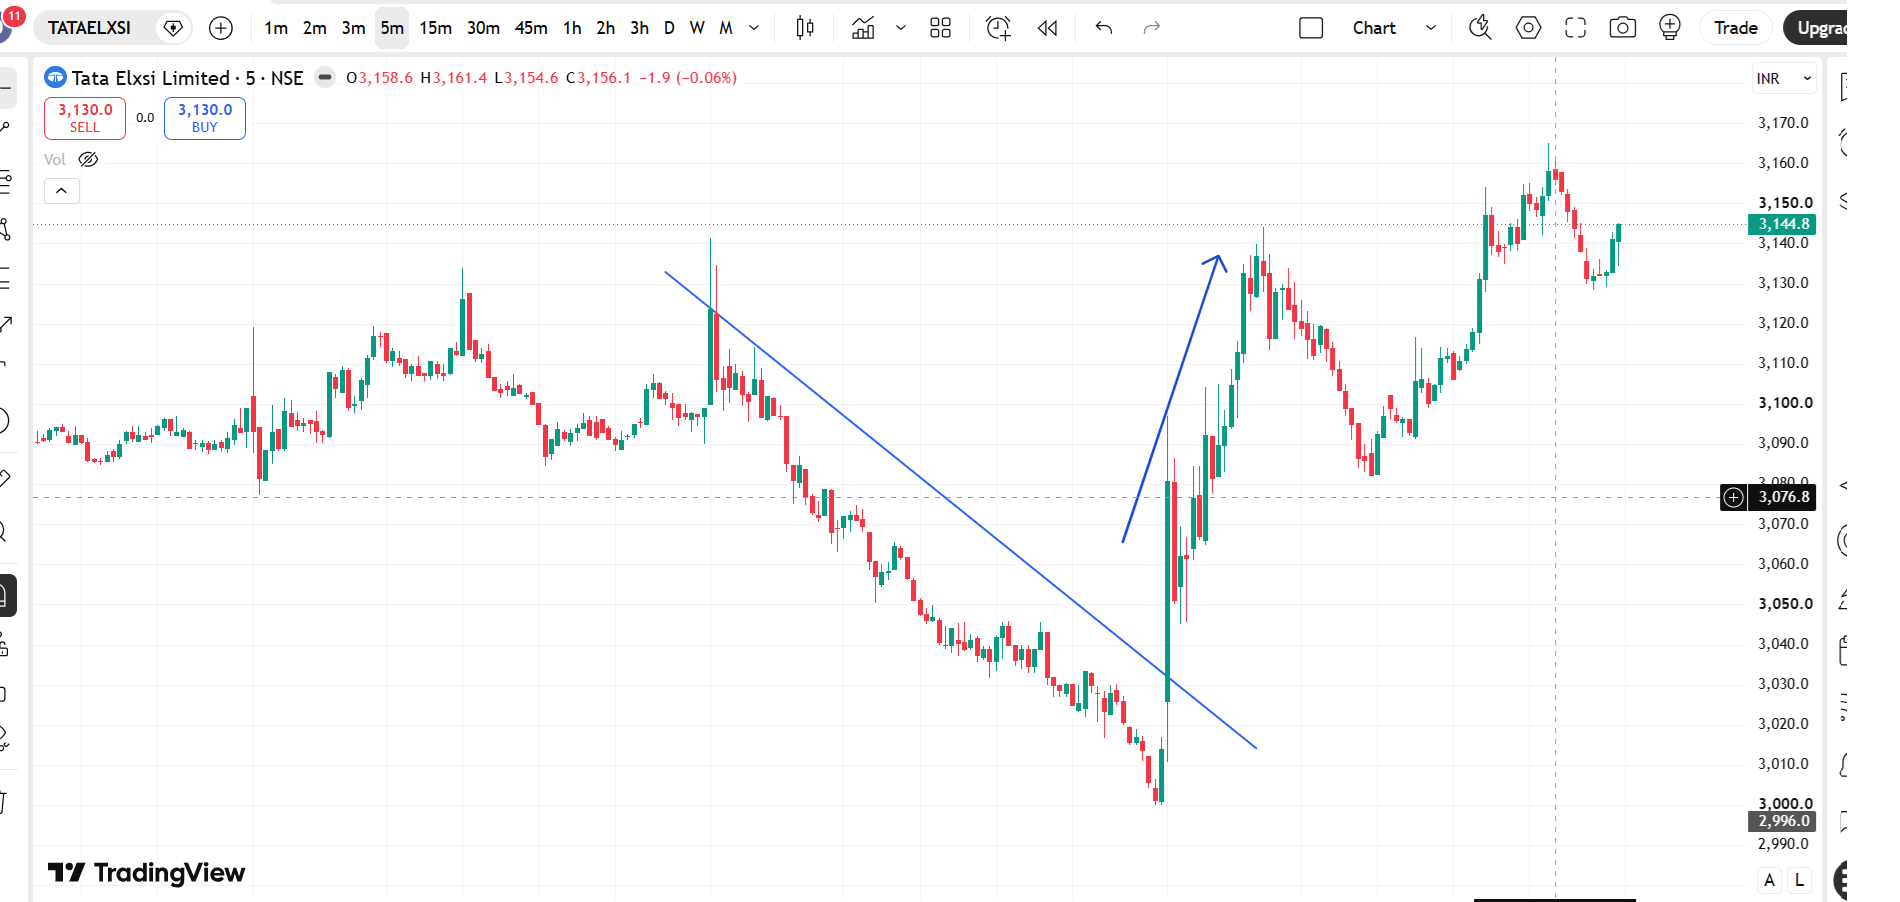
The chart at the top of this article is Tata Elxsi on the 5-minute timeframe. For most of a session, price made lower highs along the blue line, falling from about 3,140 to 3,000. Anyone short during that fall had a stop somewhere above the line.
The next morning one large candle closed back above the line. Price then ran to about 3,140, the level of the first high, before pausing. That is the whole staircase of seller stops being taken out.
This is the kind of move option buyers look for: fast, and in one direction. It is also the kind of chart that looks obvious afterwards, which is why the next section matters.
What our test showed
A pattern that looks good on a finished chart is not proof. We turned this pattern into a fixed rule and ran it over 5-minute candles for the 35 most traded F&O stocks, across 42 trading days. The rule found 1,670 breaks during market hours.
The result was plain. Thirty minutes after a break, price had moved further in the same direction about 48% of the time. Trading the reversal after the full sweep came out at about 50%. Adding a volume filter or asking for more steps did not change that much.
So the pattern is real, and it does produce the big moves you see on charts. But on its own, as a mechanical buy or sell rule, it is close to a coin flip. On a finished chart your eye picks the staircases that ended in a big candle and skips the many that broke and came straight back.
- 35 stocks, 42 trading days, 5-minute candles
- 1,670 breaks during market hours
- About 48% continued in the same direction after 30 minutes
- Breaks at a gap open looked better, but a gap jumps the level, so there is no entry
How to use the pattern sensibly
The honest use of stop-loss hunting is as a way to find charts worth looking at, not as a signal to trade blindly. When a staircase is in place and price is coming back to its level, that stock deserves your attention for the next few candles. What you do then depends on everything else you read on the chart.
- Longer staircases are rarer and easier to follow than short ones
- Check what the index is doing: a stock breaking up while Nifty falls is fighting the market
- Look at volume on the break candle compared with the candles before it
- Know where you are wrong before you enter: the low or high formed since the last step
- Remember that a fast sweep can reverse just as fast
The problem: you cannot watch 50 charts
The build-up happens quietly, on whichever stock it happens to be that day. By the time a stock shows up on a top-gainers list, the candle that mattered has already closed. Watching every F&O stock by hand is not possible for one person.
That is the reason we added two new screens to our stock market software: an F&O Screener and a Pattern Radar.
Our new F&O Screener
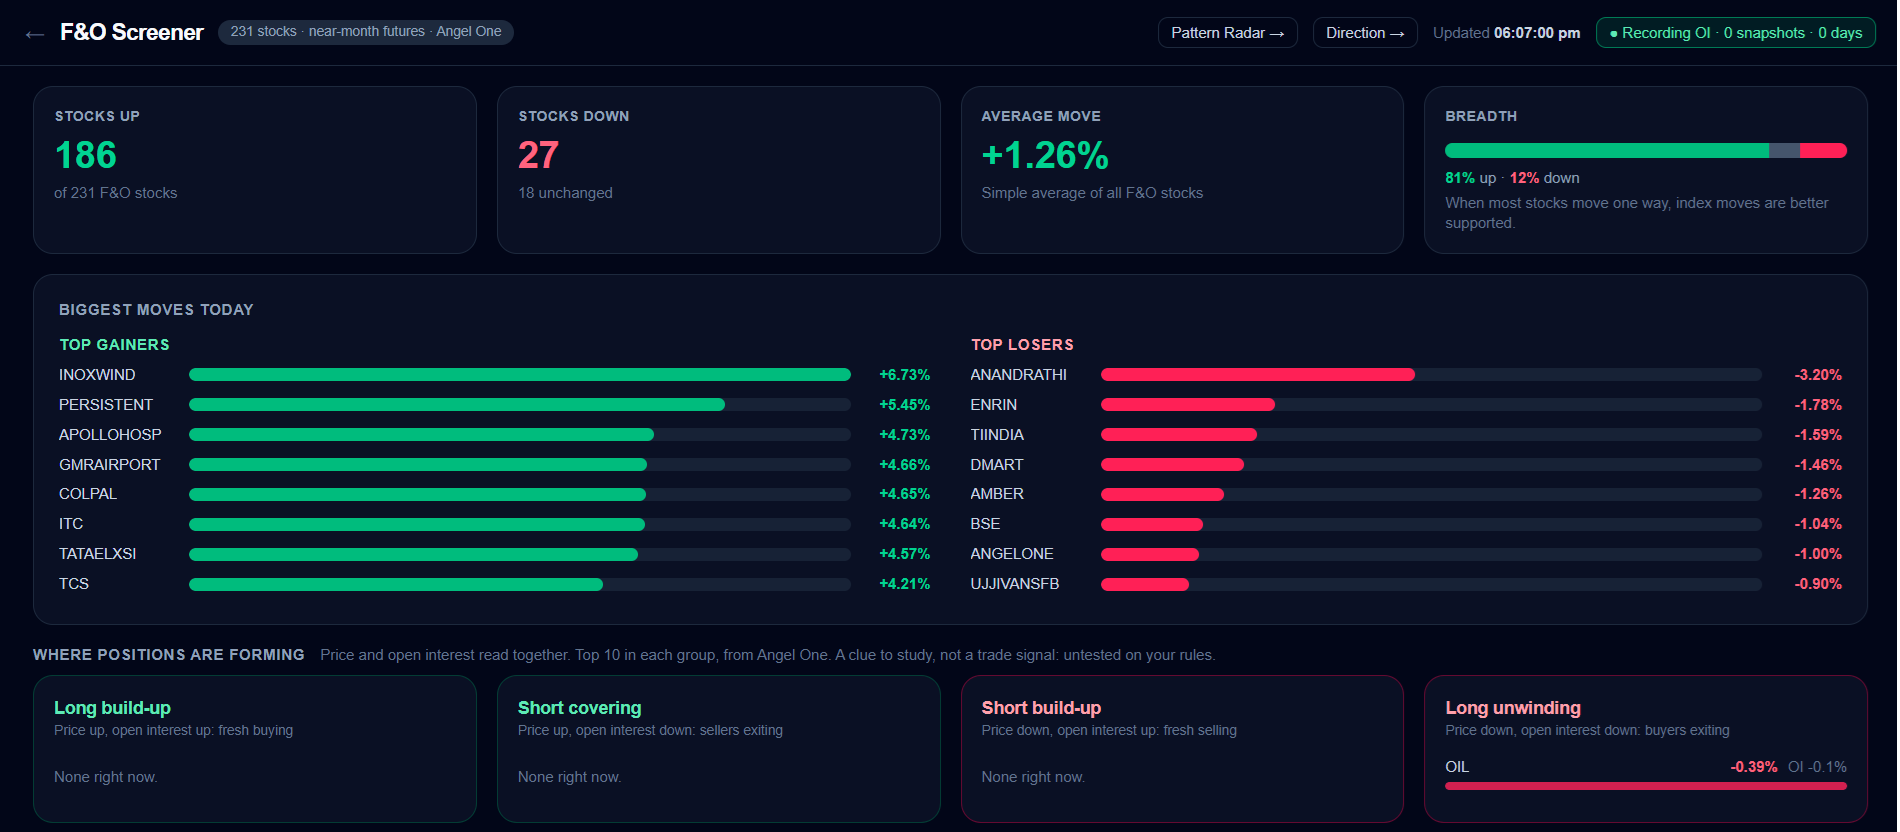
The screener reads every F&O stock, more than 200 of them, through its near-month future and refreshes every 30 seconds. It is built for finding which stocks are active right now.
- Market breadth: how many stocks are up and down, and the average move
- Biggest gainers and losers of the day as a simple bar chart
- Where positions are forming: long build-up, short covering, short build-up and long unwinding, read from price and open interest together
- Buyers versus sellers: the share of orders waiting on each side of the order book
- Put/Call ratio for each stock
- Click any stock to see its at-the-money Call and Put price and the cost of one lot
Pattern Radar: the stop-loss hunting scanner
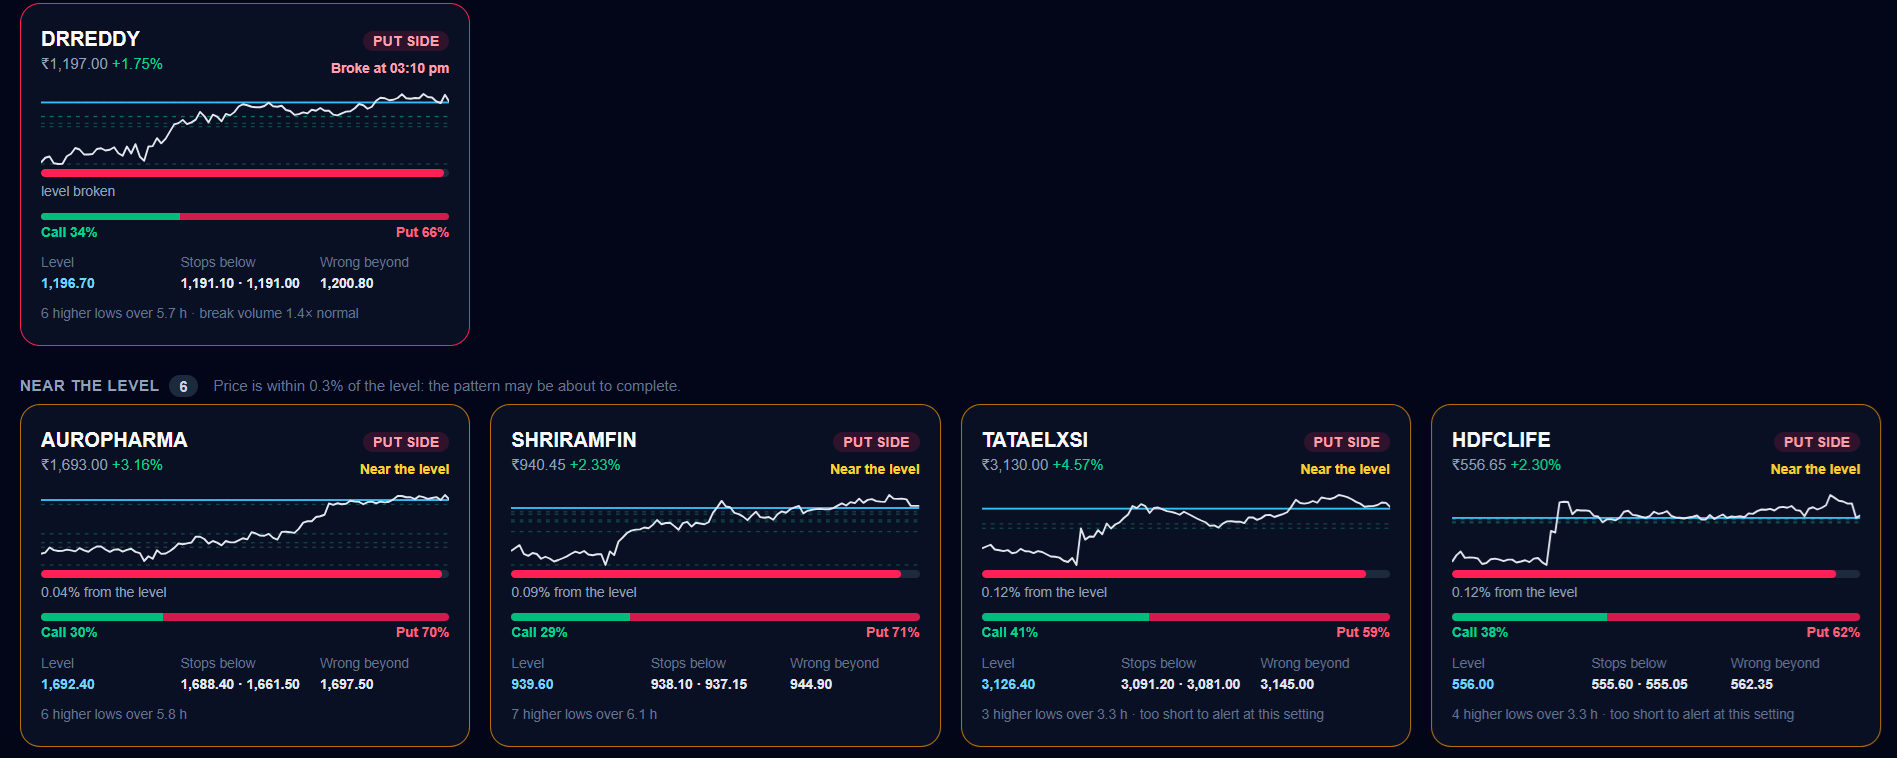
The Pattern Radar watches the 50 most active F&O stocks and re-reads them after every 5-minute candle. It looks for exactly the staircase described above and sorts what it finds into three groups.
Each stock appears as a small tile with a mini chart, the level, the next stop levels beyond it, and the price where the idea is wrong. You get a popup, a desktop notification and a voice alert that names the stock, so you only open the charts it flags. You can choose fewer or more alerts depending on how long a staircase must be.
We label it clearly as a watch-list, not a trade signal, and show the 48% test result on the screen. Its job is to save you from watching 50 charts. The decision stays with you.
- Forming: the staircase is in place, price is still some way from the level
- Near the level: price is within 0.3% of it, so the pattern may be about to complete
- Just broken: a 5-minute candle has closed through the level
How it fits with the rest of the software
These two screens sit beside the Market Direction dashboard, which reads Nifty, Bank Nifty, the big banks and India VIX every 5 minutes and says Call side, Put side or wait. The dashboard is for the index. The screener and radar are for stocks. They are kept separate so that one does not blur the other.
The screener, the option prices and the radar use a live data connection through your own broker account. Our team sets that up with you during installation.
A word on risk
OLI AI Labs is a software company, not a SEBI-registered investment adviser. Everything described here is an analysis and decision-support tool. It does not give investment advice, does not place orders and does not guarantee profit. The figures in this article are from our own tests on past data over a limited period, and live results can differ. Trading in options and futures carries a high risk of loss.
Frequently asked questions
- What is stop-loss hunting in simple words?
- It is when price moves to a level where many traders have placed stop-loss orders, triggers them, and then reverses or keeps running. Those levels are usually just above a recent high or just below a recent low.
- Is stop-loss hunting a reliable trading strategy?
- Not on its own. In our test on 35 F&O stocks over 42 trading days, a break of the pattern was followed by a move in the same direction about 48% of the time after 30 minutes. It is useful for finding charts to watch, not as a mechanical buy or sell rule.
- Which timeframe is best for spotting stop-loss hunting?
- We use the 5-minute timeframe for intraday work. The same idea appears on every timeframe, but shorter ones give more false moves and longer ones give fewer chances in a day.
- Can software see where stop-loss orders are?
- No. Stop-loss orders are hidden until they trigger. Software can only work out where they are likely to be from recent highs and lows, the same way a trader does by eye.
- What does the Pattern Radar alert me about?
- It alerts when a staircase of lower highs or higher lows is close to its level, and again when a 5-minute candle closes through it. It names the stock and the side. It does not tell you to buy or sell.
- What is long build-up and short covering in the screener?
- Long build-up is price rising with open interest rising, which suggests fresh buying. Short covering is price rising with open interest falling, which suggests sellers are closing positions. The screener shows both, along with short build-up and long unwinding.
Want the screener and Pattern Radar on your own screen?
Our team will show you the software on a live call and help you set it up on your own computer: installation, data connection, alerts and training.
See the software and request a demo