
Stock market direction software
Nifty & Bank Nifty Call or Put direction, every 5 minutes.
One screen reads Nifty, Bank Nifty, the biggest banks and India VIX together, and tells you in plain words: take the Call side, take the Put side, or wait. Built from 6+ years of studying how the market really moves.
- ✓ 5,000+ chart patterns studied
- ✓ 9 charts read together
- ✓ Our team sets it up for you
Market Direction
updates every 5 min
High probability trade
Take CALL side
Illustration of the dashboard, not live data.
6+
years of chart study behind the rules
5,000+
chart patterns studied and marked
9
charts read together on every candle
18
markets: indices, banks, commodities, crypto
Where it comes from
Built from 6+ years and 5,000+ chart patterns.
The same chart patterns form in the market again and again. Over more than six years we studied and marked over 5,000 of them on Indian index, option and commodity charts: where buyers come in, where sellers come in, where stop-losses get hunted, and how fast option premium moves afterwards. This software turns that study into clear rules.
5,000+
chart patterns studied
Marked by hand over 6+ years of Indian index, option and commodity charts.
Rules
written from what repeats
Stop-loss hunts, squeezes, banks moving together, India VIX moving opposite.
Tested
on real 5-minute data
Each rule is checked on months of real candles before it is trusted.
Kept
only if it held up
Rules that did not work on real data are removed, not hidden.
We test every rule, and we remove the ones that fail.
A pattern that looks good on a chart is not enough. Each rule is checked on months of real 5-minute market data before the software is allowed to use it. For example, we tested “buyers at support, sellers at resistance” as a trade trigger. It was right only about half the time, so the software shows those levels for your information but does not trade on them. What stays in the software is what held up.
How it works
From 9 charts to one clear answer.
Banks decide where Bank Nifty and Nifty go. So the software does not look at one chart alone. It reads all of them together on each 5-minute candle.
Step 1 · Inputs
9 charts, read together
- Nifty 50
- Bank Nifty
- HDFC Bank
- ICICI Bank
- SBI
- Axis Bank
- Kotak Bank
- Reliance
- India VIX (fear index)
Step 2 · Every 5 minutes
4 checks on each candle
- 1Are the banks moving in one direction?
- 2Do Nifty and Bank Nifty agree?
- 3Is the group breaking its last-hour high or low together (stop-losses getting hit)?
- 4Is India VIX moving the opposite way?
Step 3 · Verdict
One clear answer
- ▲ Take CALL side
- ▼ Take PUT side
- Caution: VIX does not agree
- No trade: wait
Step 4 · Alert
You are told at once
- 🔔 Desktop notification that stays on screen
- 💬 Popup on the dashboard
- 🔊 Voice: “Take call side”
Only high-probability trades alert you, about 3 a week, not all day.
The main screen
The Market Direction dashboard.
This is the real software. The big headline is the verdict. The gauge shows how strongly the market leans to Call or Put. The list on the right shows exactly why.
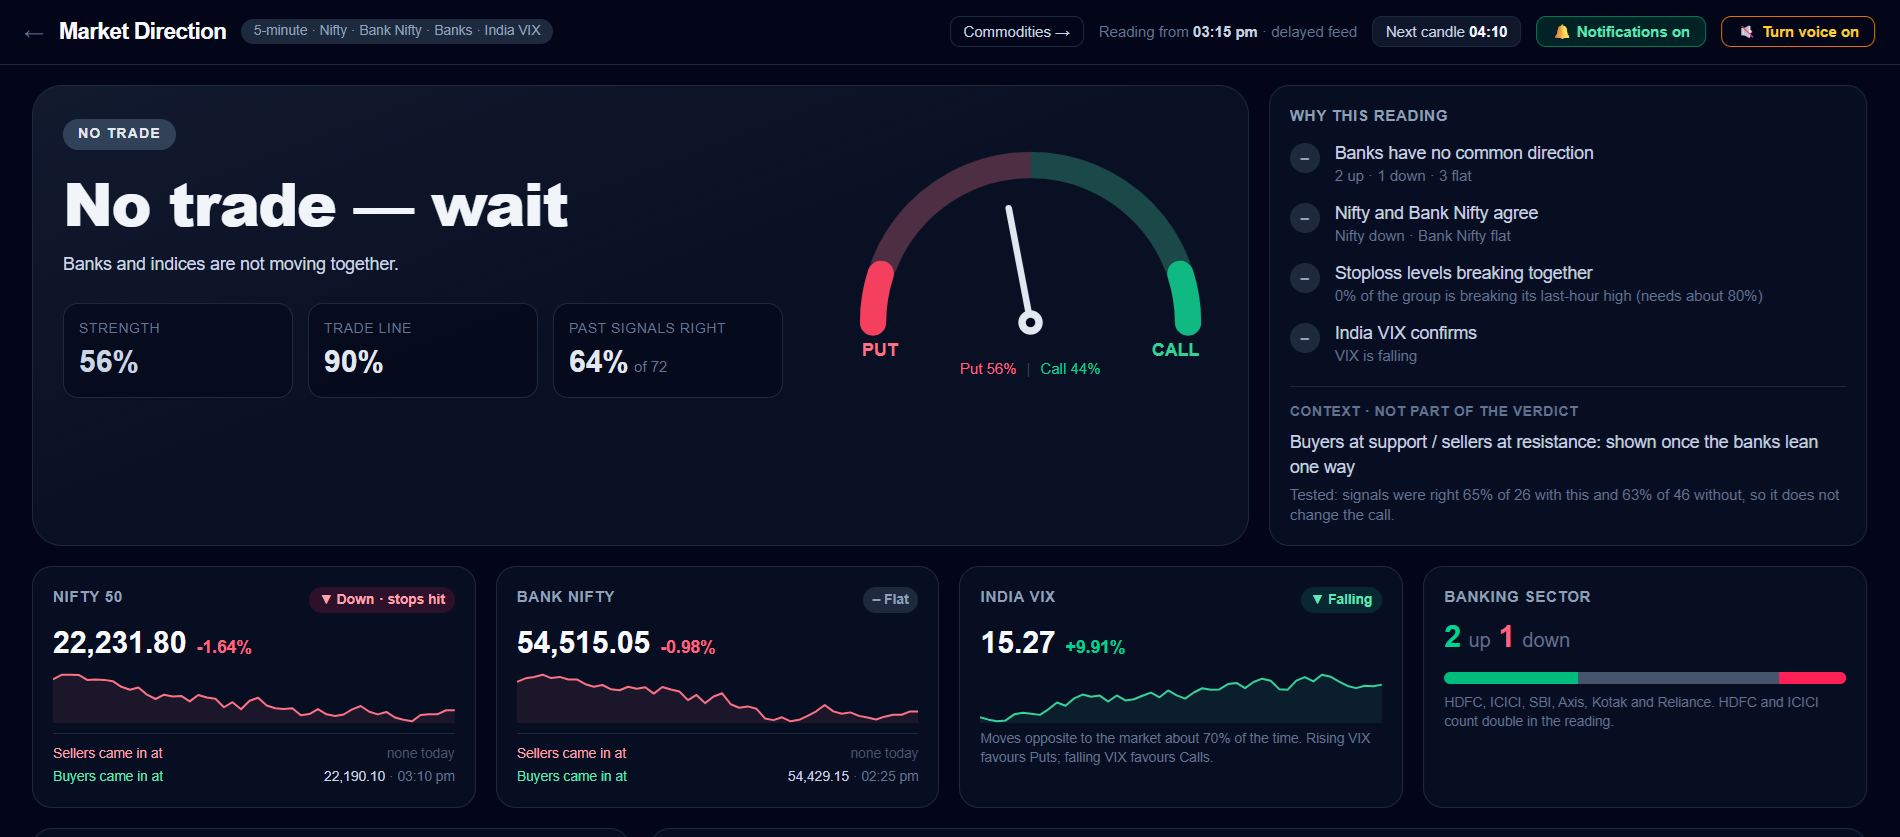
The verdict
Take Call side, Take Put side, Caution or No trade, in large text you can read from across the room.
Why this reading
Four checks with a tick or a cross: banks, indices, stop-loss levels breaking, and India VIX.
Past accuracy on screen
The dashboard shows how often signals like the current one were right before. Nothing is hidden.
High-probability alerts
You are alerted only when everything lines up.
Most signals are ordinary. The software notifies you only for the strongest kind, when all five of these are true at the same time.
- ✓Dashboard says Take Call or Take Put (stop levels breaking, VIX confirming)
- ✓Nifty and Bank Nifty both moving that way
- ✓All 5 banks moving that way: HDFC, ICICI, SBI, Axis, Kotak
- ✓Reliance moving that way
- ✓First signal of the day on that side
Desktop notification
▲ HIGH PROBABILITY CALL · 94%
Nifty, Bank Nifty, all 5 banks and Reliance are breaking up together, and India VIX is falling.
Stays on screen until you dismiss it. Voice says the side too.
74%
of high-probability alerts were right 30 minutes later
38 alerts over 59 trading days. Average move: +53 Bank Nifty points.
53%
for all other trade signals
Close to a coin flip, so these stay on screen but never send an alert.
~3
alerts a week
Fewer, better alerts. Most of the day the right answer is to wait.
These are our own test results on past 5-minute data, measured on Bank Nifty 30 minutes after each alert. The sample is small and the rule was chosen using the same data, so live results can be lower. The edge is strongest around 30 minutes and fades after that. No signal is guaranteed.
Everything inside
What the software does.
Built for option buyers, where a fast move matters more than anything else.
Market Direction dashboard
One screen with a Call / Put gauge. It reads Nifty, Bank Nifty, six heavyweight stocks and India VIX on every 5-minute candle and gives one answer: Take Call, Take Put, Caution, or No trade.
High-probability alerts only
A desktop notification, an on-screen popup and a voice alert, sent only when every condition lines up. About 3 alerts a week in our testing, so you are not disturbed all day.
Banking sector reading
See at a glance how many banks are moving up, down or flat. HDFC Bank and ICICI Bank count double, because they move Bank Nifty the most.
India VIX confirmation
India VIX usually moves opposite to the market. The software only calls a trade when VIX agrees: falling for a Call, rising for a Put.
Buy Here / Sell Here marks
Arrows on the chart where a stop-loss hunt happened: price swept a recent high or low and either reversed or ran. The same idea traders mark by hand, found automatically.
4 or 6 charts on one screen
Watch several markets together. When a signal appears, the software says the chart name out loud, for example “Bank Nifty. Buy here.”
Support and resistance levels
Shows the price where buyers last stepped in and where sellers last pushed back, with the time, for Nifty, Bank Nifty and commodities.
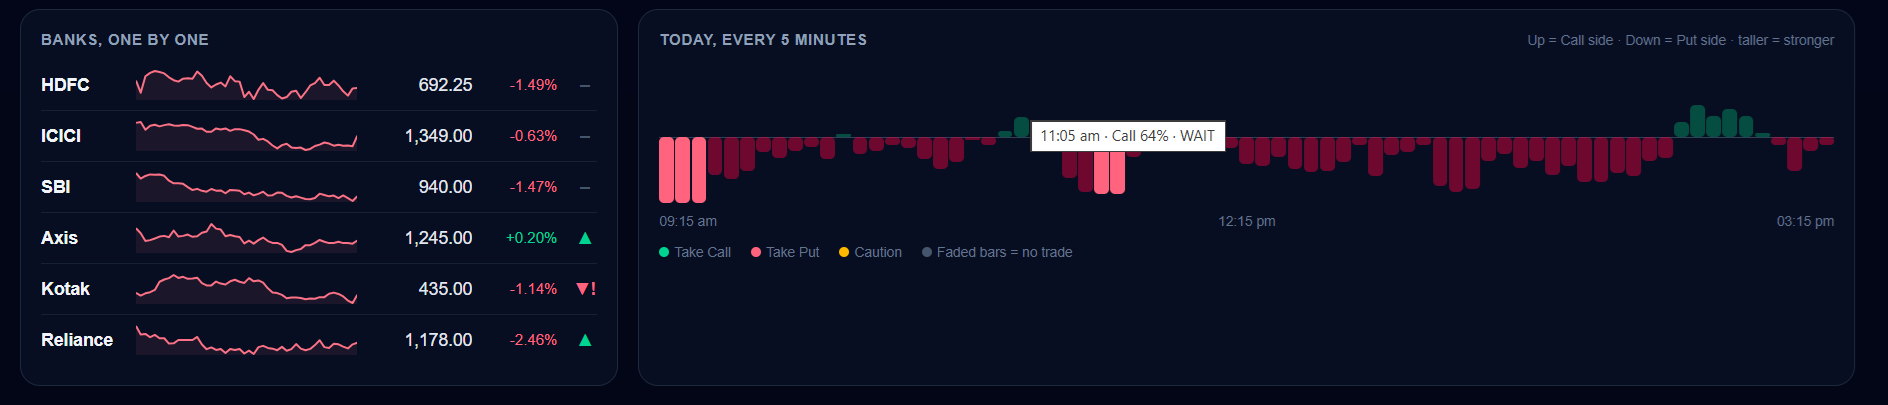
Today, every 5 minutes
A bar for each 5-minute candle shows how the reading moved through the day, so you can see when the market leaned Call side or Put side.
Commodity futures dashboard
Natural Gas, Crude Oil, Gold and Silver, each with the current-month and next-month future side by side, trend, key levels and the busiest trading hours.
Option chain and expiry calendar
Option chain and option-premium charts for index options through your Dhan account, plus a calendar of upcoming expiry days.
Trade journal
Write down the level, the reason and the plan for each idea, tagged by instrument, so you can review your own trading later.
Signal log and results
Every signal is saved with what happened afterwards. A monitoring page shows the win rate by signal type, so you can judge it on results.
Every 5 minutes
See the whole day at a glance.
Each bar is one 5-minute candle. Bars above the line lean to the Call side, bars below lean to the Put side, and taller bars are stronger. The bright bars are the moments a trade was called.
Illustration of the timeline. The real one is in the screenshot.
See it in action
Real screens, real market moves.
When price sweeps a recent high or low to hit stop-losses and then reverses or runs, the software marks it on the chart as Buy Here or Sell Here. These are real screens from the software, plus one chart from the study behind it. Marks are placed on past candles; no mark is a guarantee of the next move.
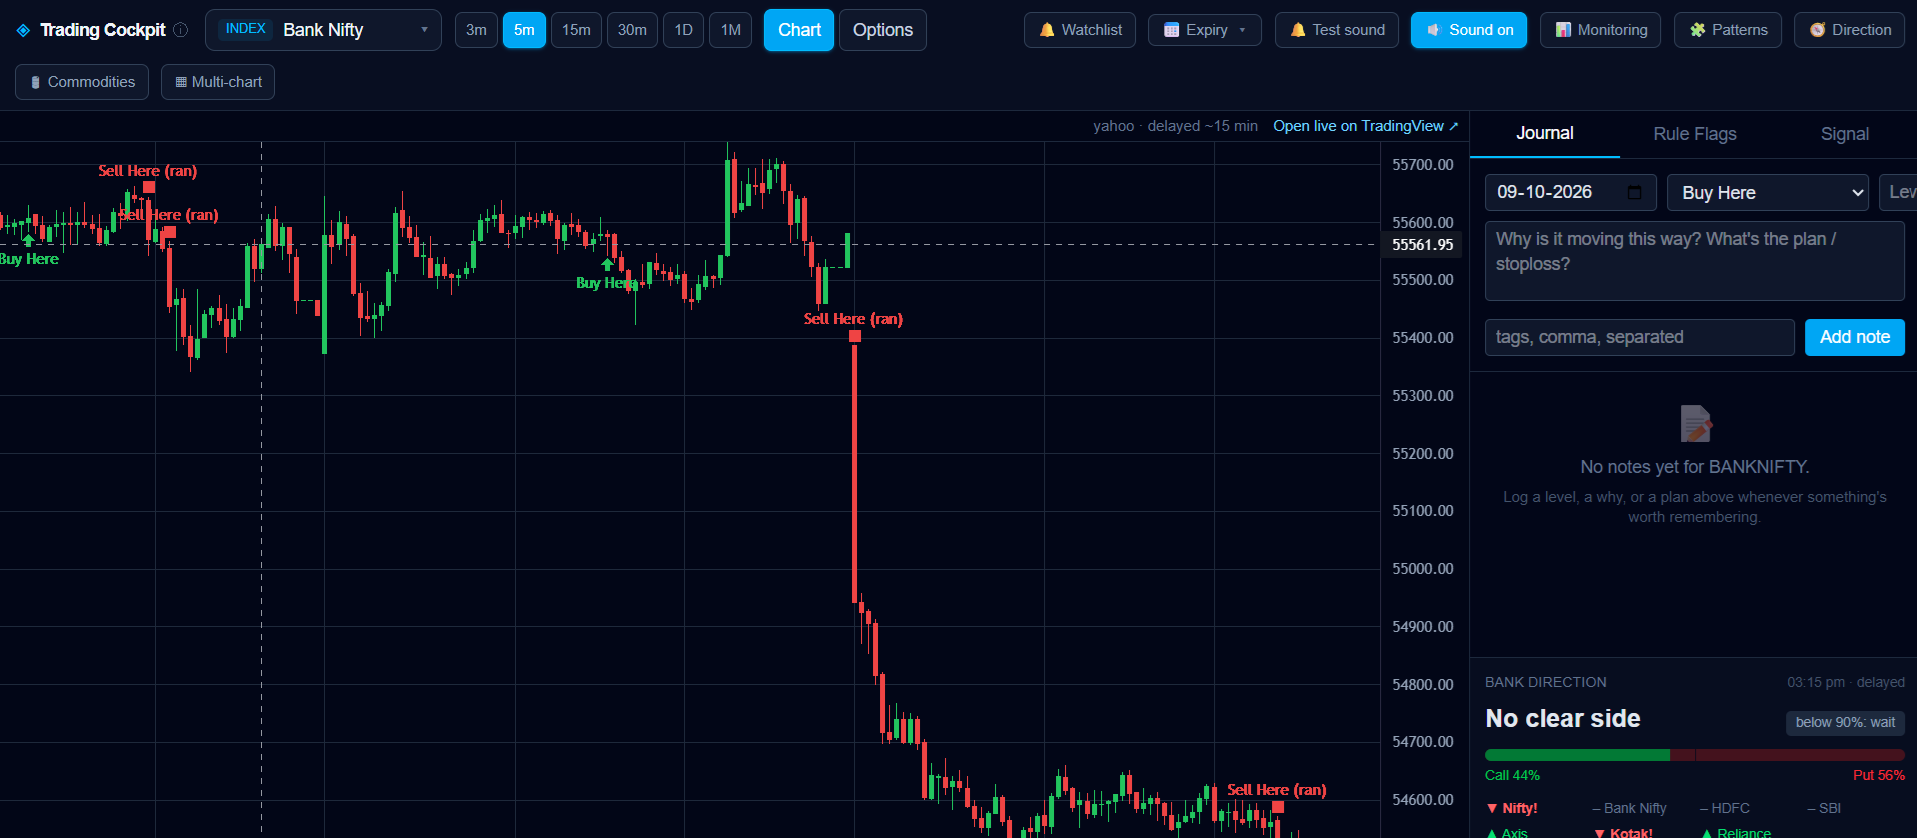
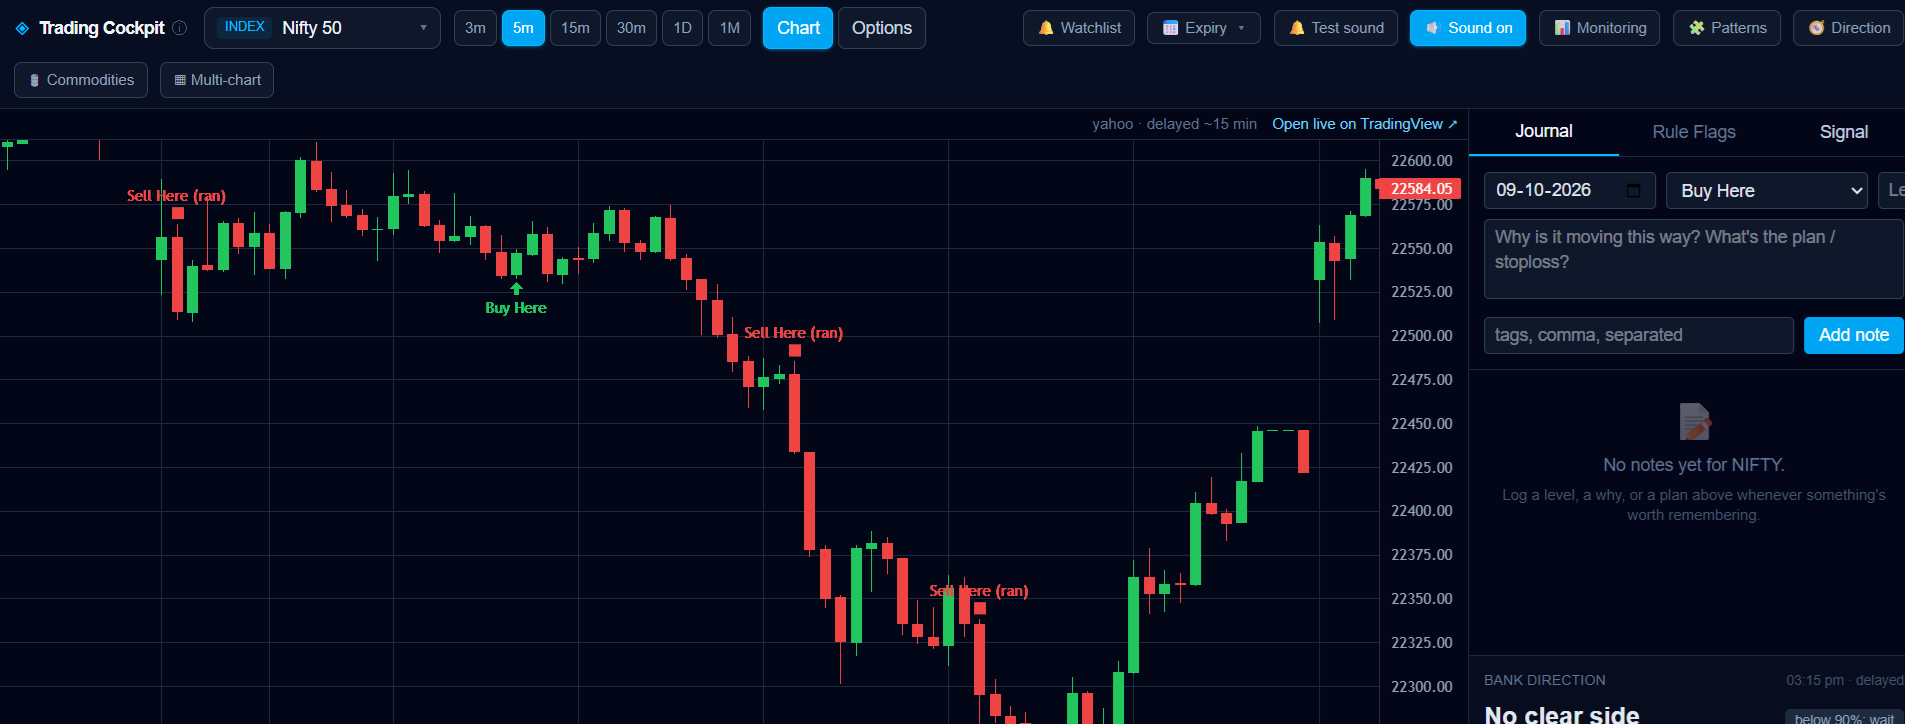
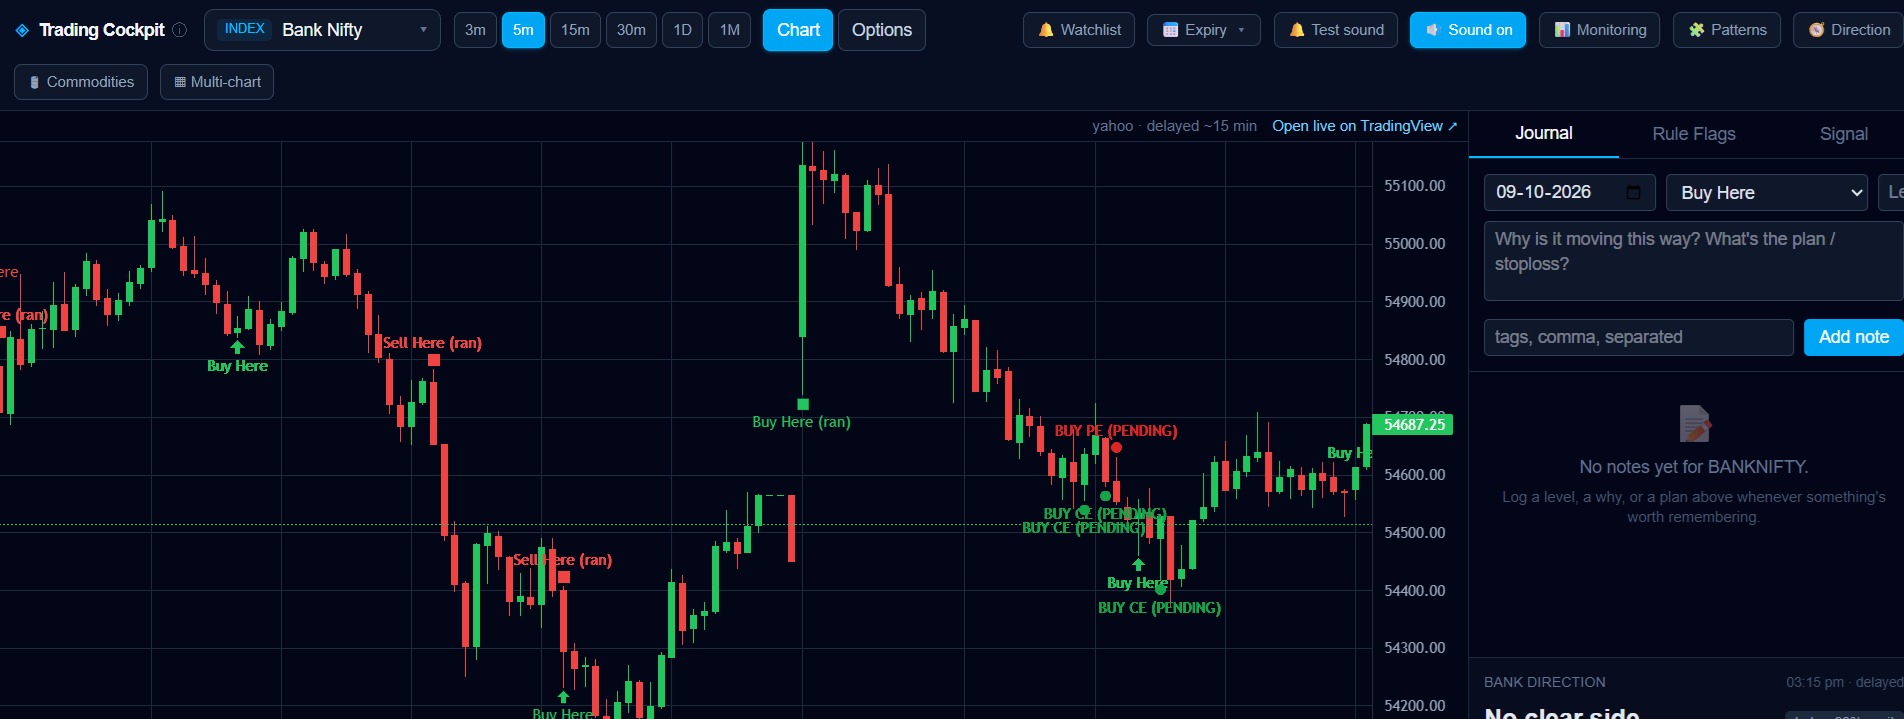
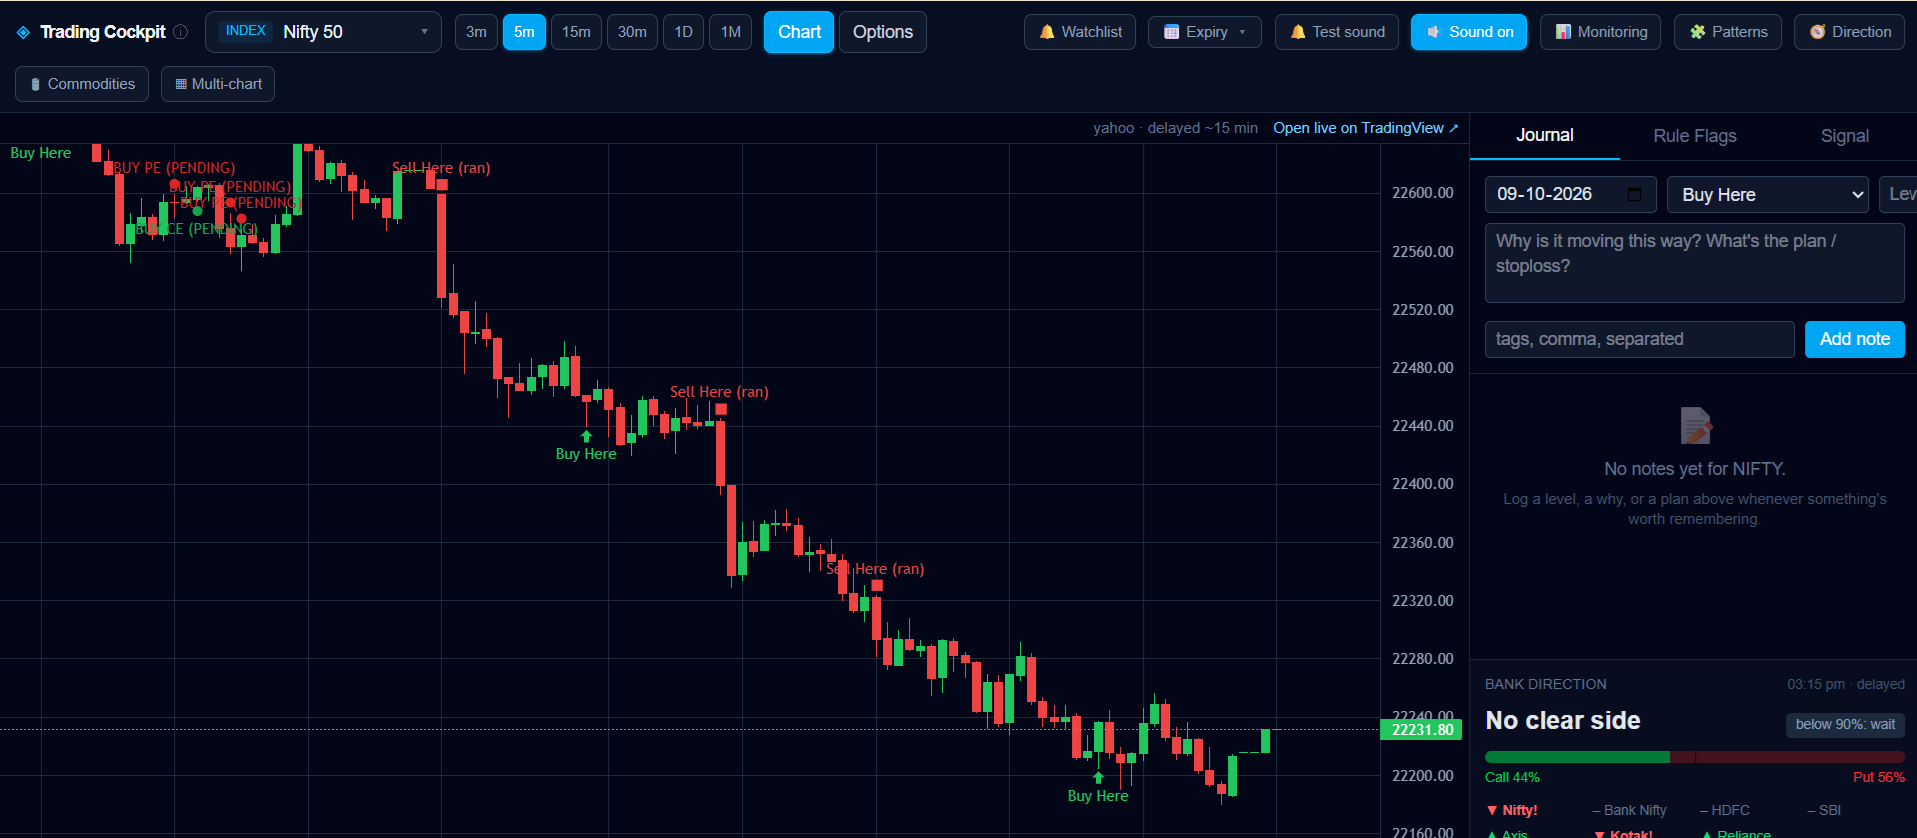
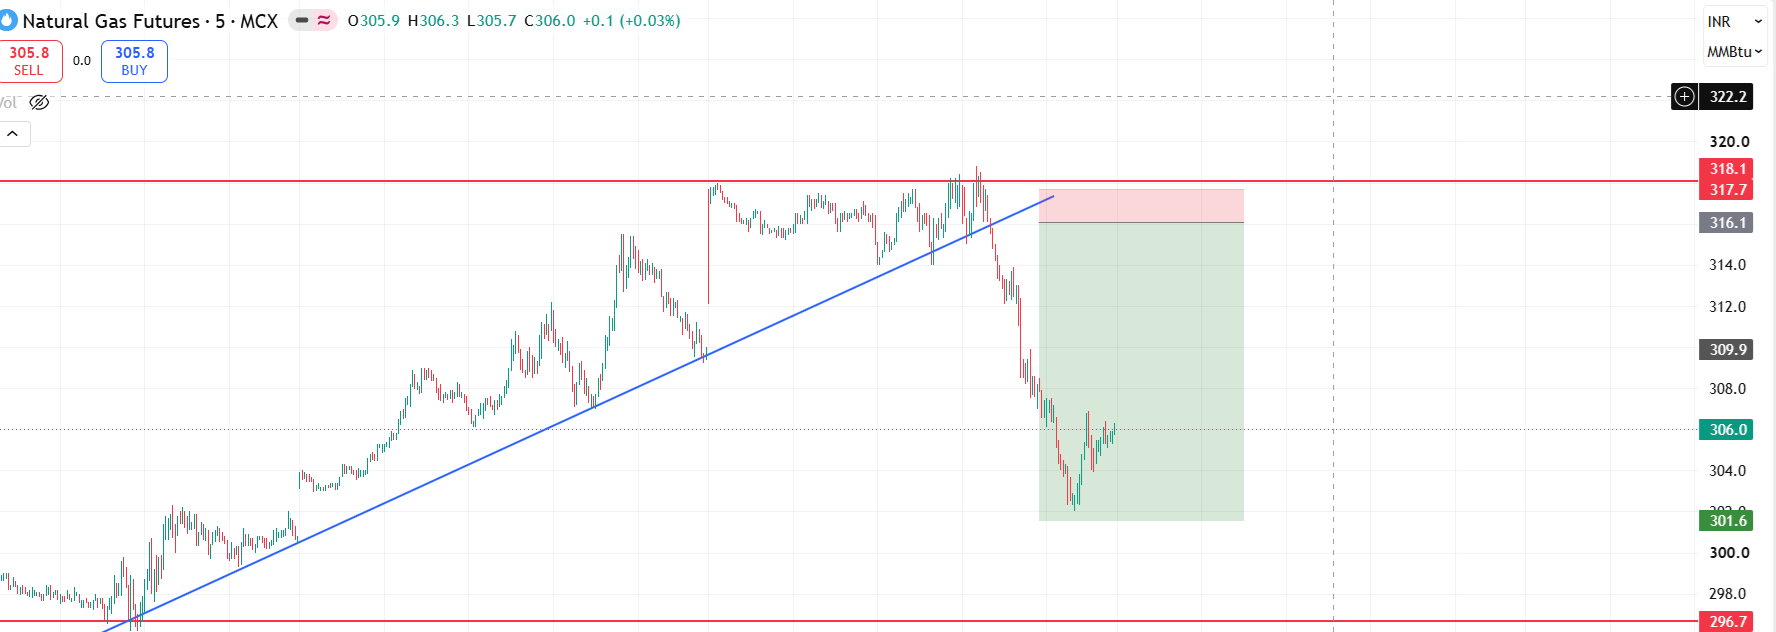
A one-way Put-side move in Bank Nifty.
Bank Nifty on the 5-minute chart. After two sideways sessions it dropped about 800 points in a single one-way move. A Sell Here mark sits right where the fall began, and another appears near the lows.
- Sell Here mark at the start of the fall
- About 800 points in one direction
- Fast moves like this are what option buyers wait for
1 / 5
New · for F&O stocks
A stock screener and a stop-loss hunting radar.
The Market Direction dashboard is for the index. These two new screens are for stocks. One shows which F&O stocks are active right now; the other watches the 50 most active ones for the stop-loss hunting pattern and tells you when to look.
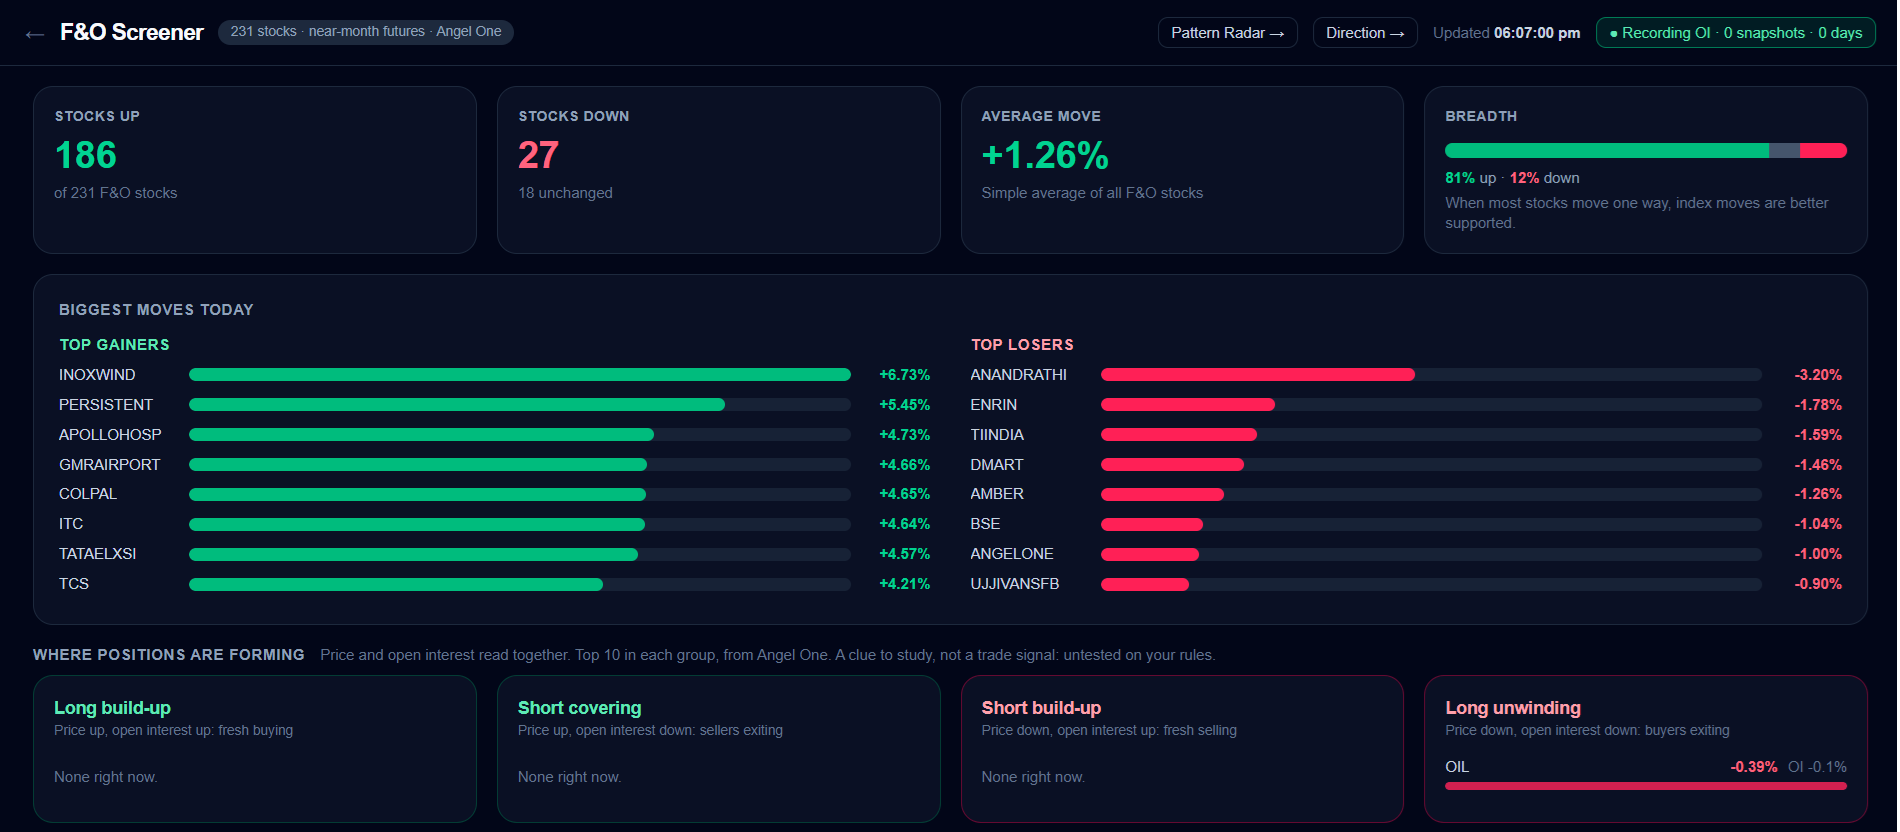
F&O Screener
Reads every F&O stock, more than 200 of them, through its near-month future and refreshes every 30 seconds. In one look you know whether the whole market is moving one way and which stocks are leading it.
- Market breadth: how many stocks are up and down, and the average move
- Top gainers and losers of the day as a simple bar chart
- Long build-up, short covering, short build-up and long unwinding, read from price and open interest together
- Buyers versus sellers in the order book, and the Put/Call ratio, for each stock
- Click a stock for its at-the-money Call and Put price and the cost of one lot
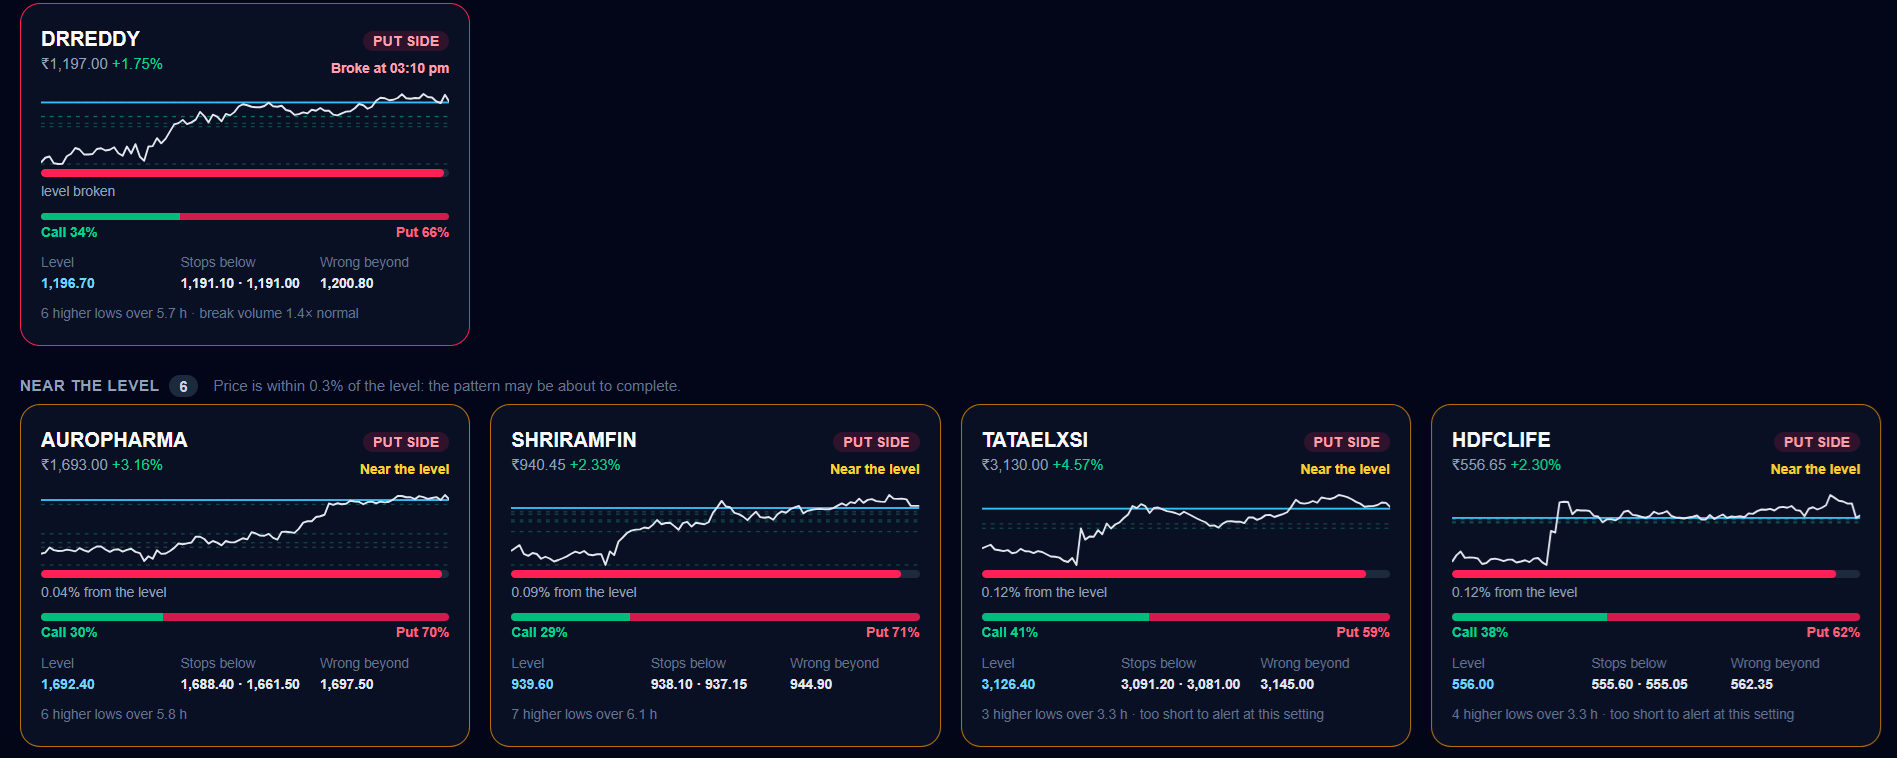
Pattern Radar
When sellers step in at lower and lower highs, their stop-losses stack up above each one. When buyers step in at higher and higher lows, theirs stack up below. The radar finds these staircases on 5-minute charts and re-checks 50 stocks after every candle, so you do not have to.
- Forming, Near the level, Just broken: three groups, so you see what needs attention first
- Each tile shows a mini chart, the level, the next stop levels and where the idea is wrong
- Call % and Put % from buyers and sellers in the order book
- Popup, desktop notification and a voice alert that names the stock
- Choose fewer or more alerts, and click a tile to open the chart
Markets covered
Also works for Bitcoin, Ethereum, Gold, Silver and Natural Gas.
The same charts, marks, alerts and multi-chart screen work across Indian indices, bank stocks, commodities and crypto.
Nifty, Bank Nifty, Sensex
- Full Call / Put direction verdict (Nifty and Bank Nifty)
- High-probability alerts
- Buy Here / Sell Here marks
- Option chain with Dhan
Bitcoin and Ethereum
- Live crypto charts (Bitcoin, Ethereum, Solana)
- Buy Here / Sell Here marks
- Voice alert with the chart name
- Multi-chart screen
Gold and Silver
- Current-month and next-month futures
- Bullish / Bearish / Sideways reading
- Where buyers and sellers stepped in
- Best trading hours highlighted
Natural Gas and Crude Oil
- Current-month and next-month futures
- Last-hour high and low
- Speed meter: fast, normal or slow
- 4 PM – 9 PM IST marked as the active window
To be clear: the full Call / Put direction verdict is built for Nifty and Bank Nifty, because it depends on the banks and India VIX. For crypto and commodities the software shows the trend, the key levels and the Buy Here / Sell Here marks, and you read the chart with them. Commodity charts use the global Gold, Silver, Natural Gas and Crude Oil futures, which MCX prices follow.
Straight talk
What it is, and what it is not.
What it is
- ✓ A tool that watches 9 charts for you so you do not miss a move.
- ✓ Rules that were tested on real data, with the results shown on screen.
- ✓ Software that runs on your own computer. Your trades and notes stay with you.
- ✓ A way to trade less often and wait for the stronger setups.
What it is not
- ✕ Not a guarantee of profit. Some alerts will be wrong.
- ✕ Not a tips service or investment advice.
- ✕ Not an auto-trading robot. You place every trade yourself.
- ✕ Not a replacement for a stop-loss and your own judgement.
Getting started
Our team sets it up on your system.
You do not need to be technical. We do the installation with you, step by step.
Send the form
Tell us which markets you trade. We reply within one business day.
See a live demo
We show you every screen on a call and answer your questions.
We install it for you
Our team sets the software up on your Windows or Mac computer and turns on alerts.
Training and support
We walk you through reading the dashboard and stay available for help.
Questions traders ask
- What is this stock market prediction software?
- It is a trading dashboard for option buyers. Every 5 minutes it reads Nifty, Bank Nifty, HDFC Bank, ICICI Bank, SBI, Axis Bank, Kotak Bank, Reliance and India VIX together, and tells you whether the market is leaning to the Call side, the Put side, or whether you should wait. It is a decision-support tool: you still place your own trades.
- How does it decide between Call and Put?
- It checks four things on each 5-minute candle: are the banks moving in one direction, do Nifty and Bank Nifty agree, is the whole group breaking its last-hour high or low together (which is where stop-losses sit), and is India VIX moving the opposite way. A trade is only called when these line up.
- How accurate are the Call and Put signals?
- We publish our test results instead of promising a number. On 59 trading days of 5-minute data, the high-probability alerts fired 38 times, and Bank Nifty had moved in the called direction 30 minutes later in 74% of them. Other signals were right about 53% of the time, which is why they do not alert. These are past test results on a small sample. Live results can be lower, and no signal is guaranteed.
- Does it work for Bitcoin, Ethereum, Gold, Silver and Natural Gas?
- Yes. Charts, Buy Here / Sell Here marks, voice alerts and the multi-chart screen work for Bitcoin, Ethereum, Gold, Silver, Natural Gas and Crude Oil. Commodities also have their own futures dashboard with trend and key levels. The full Call / Put direction verdict is built for Nifty and Bank Nifty, because it depends on the banks and India VIX.
- Is the market data live?
- Charts for Nifty, Bank Nifty, the banks, India VIX and crypto update within seconds of the market. Commodity futures charts (Gold, Silver, Natural Gas, Crude Oil) can run a few minutes behind. The option chain works through your own Dhan account and needs Dhan's data plan. We explain the current status clearly during your demo.
- Will your team install it on my computer?
- Yes. The software runs on your own Windows or Mac computer and opens in your browser. Our team helps you install it, connect your data, turn on notifications and learn each screen. Fill in the form on this page and we will contact you within one business day.
- Do I need coding knowledge to use it?
- No. After setup you open it like a website. Everything is shown in plain English, with green for the Call side and red for the Put side.
- Is this investment advice or a tips service?
- No. OLI AI Labs is a software company. This is an analysis and decision-support tool. It does not give investment advice, does not manage money and does not guarantee profit. Trading in options, futures and crypto carries a high risk of loss. Please trade only with money you can afford to lose and consult a SEBI-registered adviser if you need advice.
Request a demo
See it on your own market, then let us set it up.
Fill in the form and our team will help you with the complete setup on your system: installation, data connection, alerts and training.
- ✓Reply within 1 business dayA real person from our team, not an auto-reply.
- ✓Free live demoWe show the dashboard on the markets you trade.
- ✓Setup done for youOur team installs and configures it on your computer.
- ✓Help after setupTraining on every screen, and support when you need it.
- hello@oliailabs.com
- Phone
- +91 7499454238 (WhatsApp only)
- Office
- Pune, India
Tell us about your trading
Fields marked * are required. It takes about a minute.
Risk disclaimer: OLI AI Labs is a software company, not a SEBI-registered investment adviser or research analyst. This software is an analysis and decision-support tool. Nothing on this page or in the software is investment advice or a recommendation to buy or sell any security, option, future or crypto asset. Trading in derivatives, commodities and crypto involves a high risk of loss, and most intraday option traders lose money. Figures shown are from our own tests on past data and do not guarantee future results. You are responsible for your own trading decisions. Please consult a SEBI-registered adviser before investing.