
Nifty & Bank Nifty Call Put Direction Software: How It Works
The problem every option buyer has
If you buy options, being right about direction is not enough. The move also has to be fast. Option premium loses value every minute, so a slow move in the right direction can still lose money.
That means an option buyer has two questions all day: is the market going to the Call side or the Put side, and is this a real one-way move or just noise? Most traders try to answer this by watching Nifty or Bank Nifty alone. That is where many wrong trades come from.
We built a piece of software to answer those two questions in a calmer, more disciplined way. This article explains what it does, how it decides, what our testing showed, and where its limits are.
Built from 6+ years and 5,000+ chart patterns
The software did not start as code. It started as chart study. Over more than six years we studied and marked over 5,000 chart patterns on Indian index, option and commodity charts: where buyers came in, where sellers came in, where stop-losses were hunted, and how fast option premium moved afterwards.
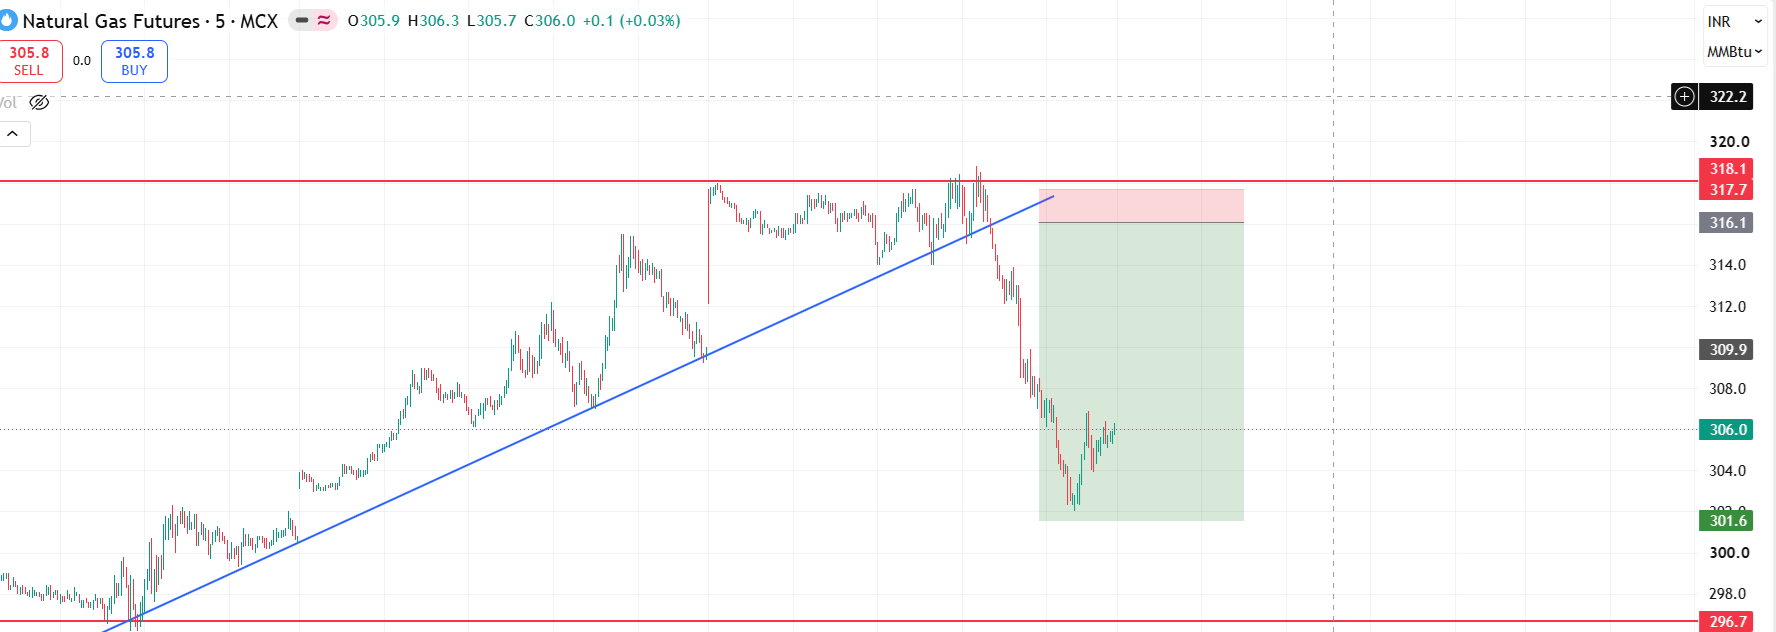
The same patterns form again and again. The chart below is one example from that study. Natural Gas climbed along a rising trendline, met sellers at resistance near 318, broke the trendline, and fell quickly to about 302. A trendline break at resistance, followed by a fast move, is exactly the kind of behaviour the software's rules come from.
The main idea: banks move the index
Bank Nifty does not move by itself. It moves because the big banks inside it move. Nifty is also pulled by the same banks and by Reliance. So instead of reading one chart, the software reads nine charts together on every 5-minute candle.
- Nifty 50 and Bank Nifty
- HDFC Bank, ICICI Bank, SBI, Axis Bank and Kotak Bank
- Reliance
- India VIX, the fear index
Four checks on every 5-minute candle
On each new candle the software runs four checks. When they line up, it calls a side. When they do not, it says wait. Waiting is the answer for most of the day, and that is on purpose.
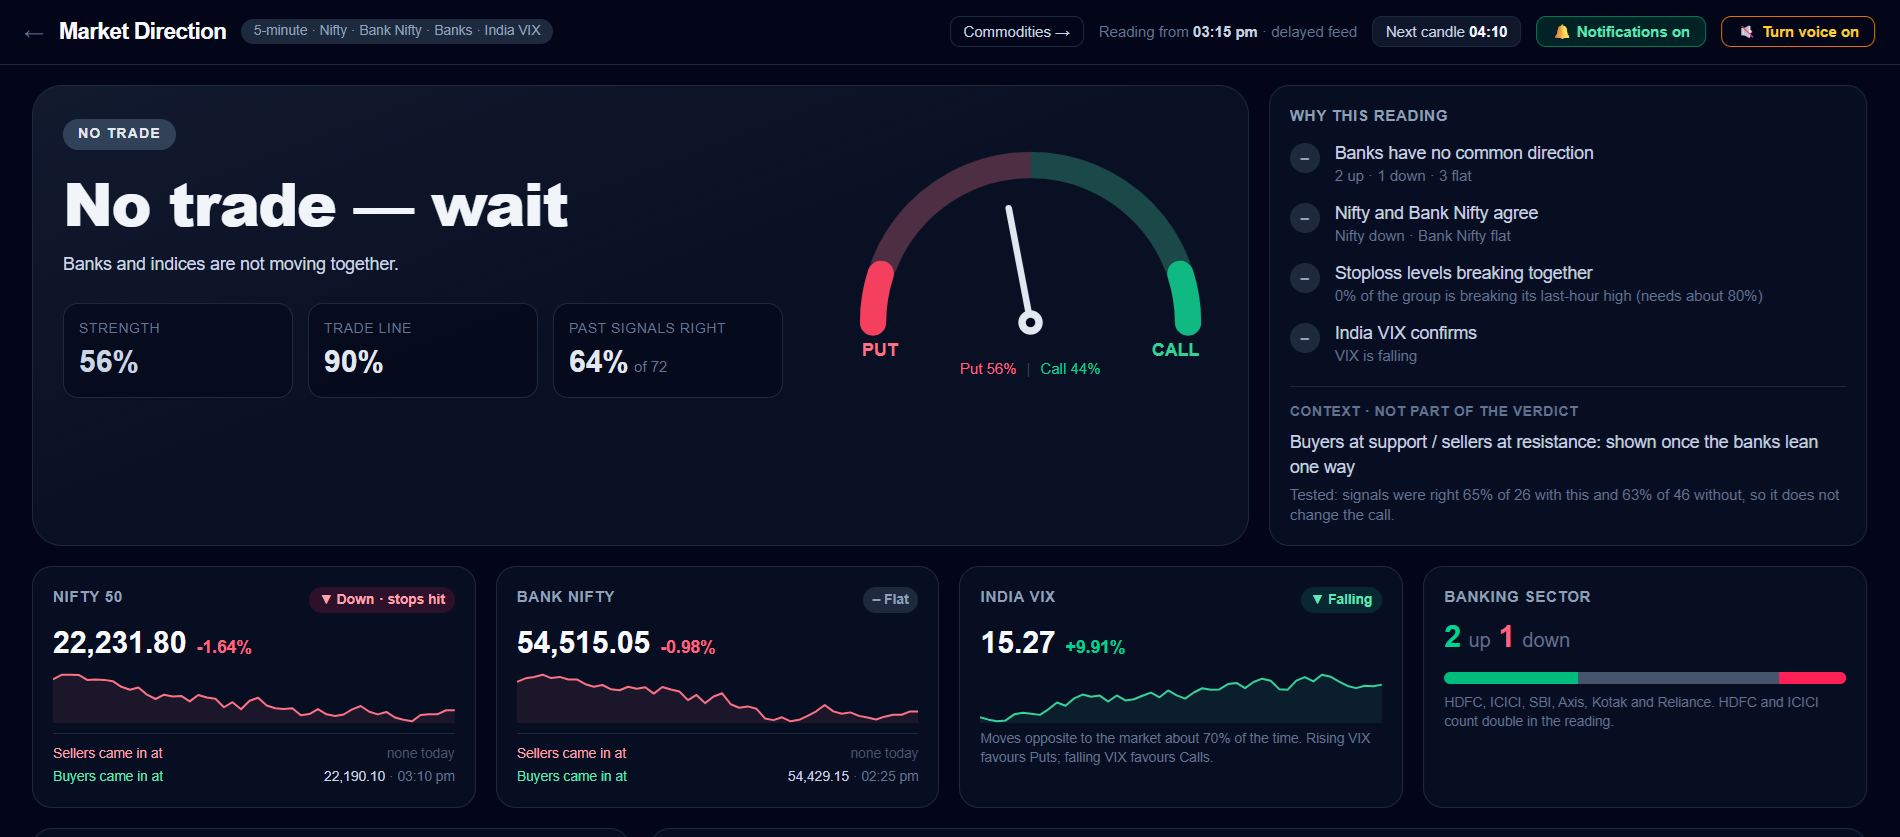
The screen at the top of this article is the Market Direction dashboard. The large headline is the verdict. The gauge shows how strongly the market leans to Call or Put. The list on the right shows each check with a tick or a cross, so you always know why it says what it says.
- Are the banks moving in one direction?
- Do Nifty and Bank Nifty agree with them?
- Is the whole group breaking its last-hour high or low together? That is where stop-losses sit.
- Is India VIX moving the opposite way?
Why India VIX has to agree
Many traders notice that when India VIX rises the market falls, and when VIX falls the market rises. We tested this on about three months of 5-minute data. India VIX moved in the opposite direction to Bank Nifty in about 70% of 30-minute windows.
So the software uses VIX as a confirmation. It calls a Call-side trade only when VIX is falling, and a Put-side trade only when VIX is rising. If the banks point one way but VIX does not agree, the dashboard shows Caution instead of a trade. In our testing those caution cases were right only about half the time.
You are alerted only for high-probability trades
A tool that alerts all day is a tool you stop listening to. So the software sends a desktop notification, an on-screen popup and a voice alert only for the strongest kind of signal, when all five of these are true together.
Here is what our test showed. Over 59 trading days of 5-minute data, these high-probability alerts fired 38 times. Bank Nifty had moved in the called direction 30 minutes later in 74% of them, with an average move of 53 points. All other trade signals were right about 53% of the time, which is close to a coin flip, so they stay on screen but never send an alert. That works out to roughly three alerts a week.
Please read those numbers carefully. They are our own test results on past data. The sample is small, and the rule was chosen using the same data, so live results can be lower. The edge was strongest around 30 minutes and faded after that. No signal is guaranteed.
- The dashboard says Take Call or Take Put, with stop levels breaking and VIX confirming
- Nifty and Bank Nifty are both moving that way
- All five banks are moving that way
- Reliance is moving that way
- It is the first signal of the day on that side
What a one-way move looks like
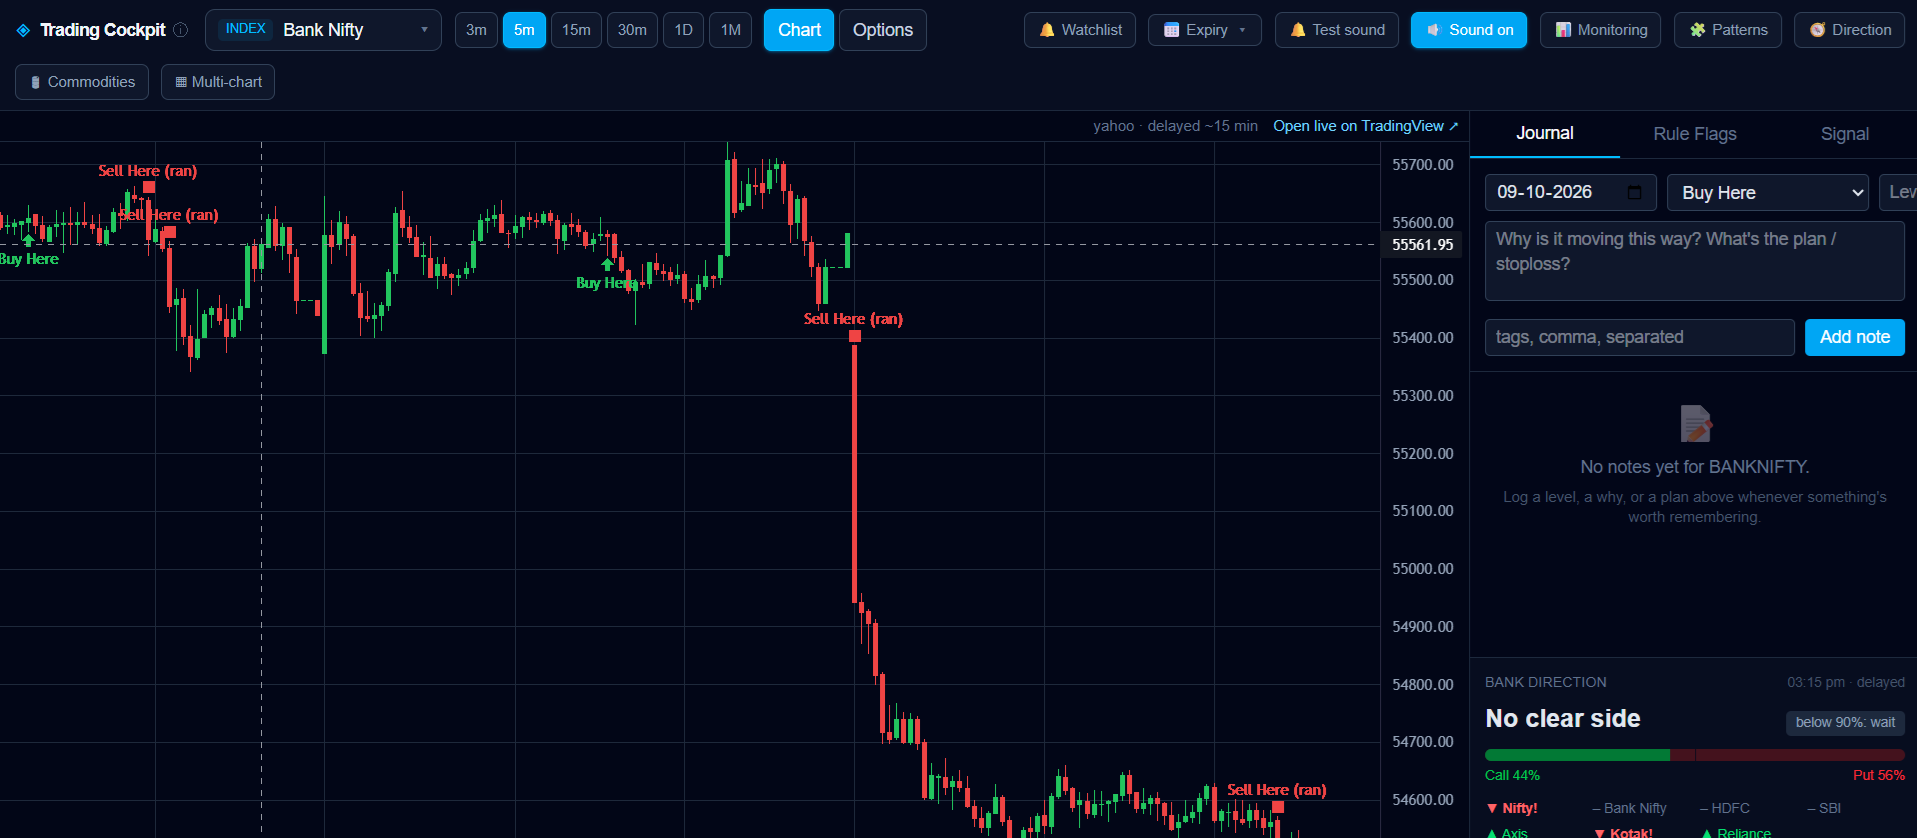
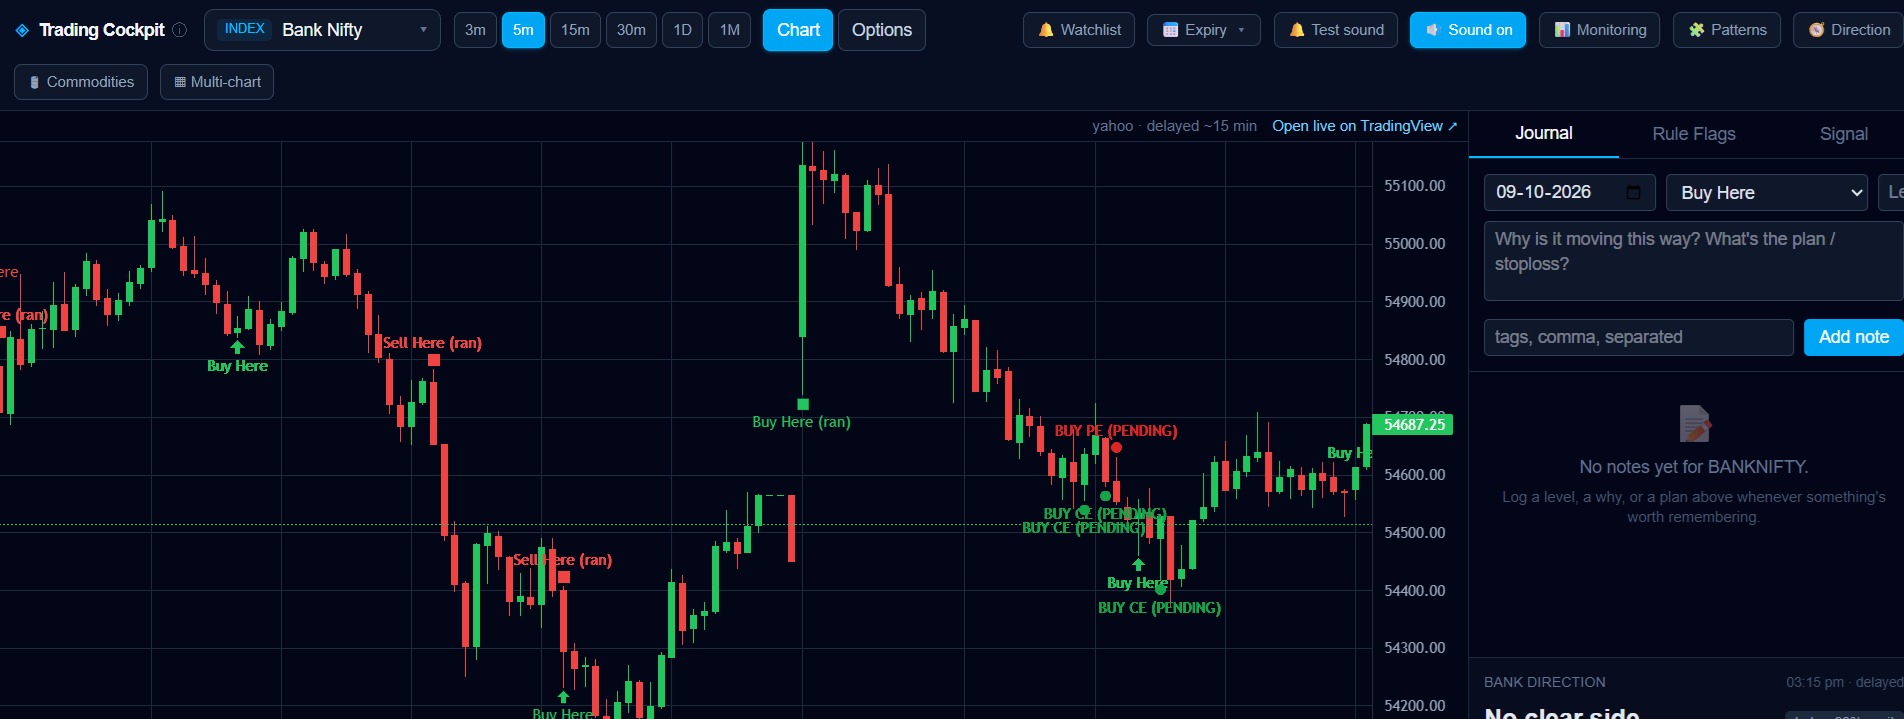
This is the kind of move option buyers wait for. In the screen below, Bank Nifty spent two sessions going sideways and then dropped about 800 points in one direction. A Sell Here mark sits right where the fall began, and another appears near the lows.
A Sell Here or Buy Here mark is placed when price sweeps a recent high or low, hits the stop-losses resting there, and then either reverses or keeps running. Traders often mark these stop-loss hunts by hand. The software finds them on the chart for you.
The same thing on Nifty
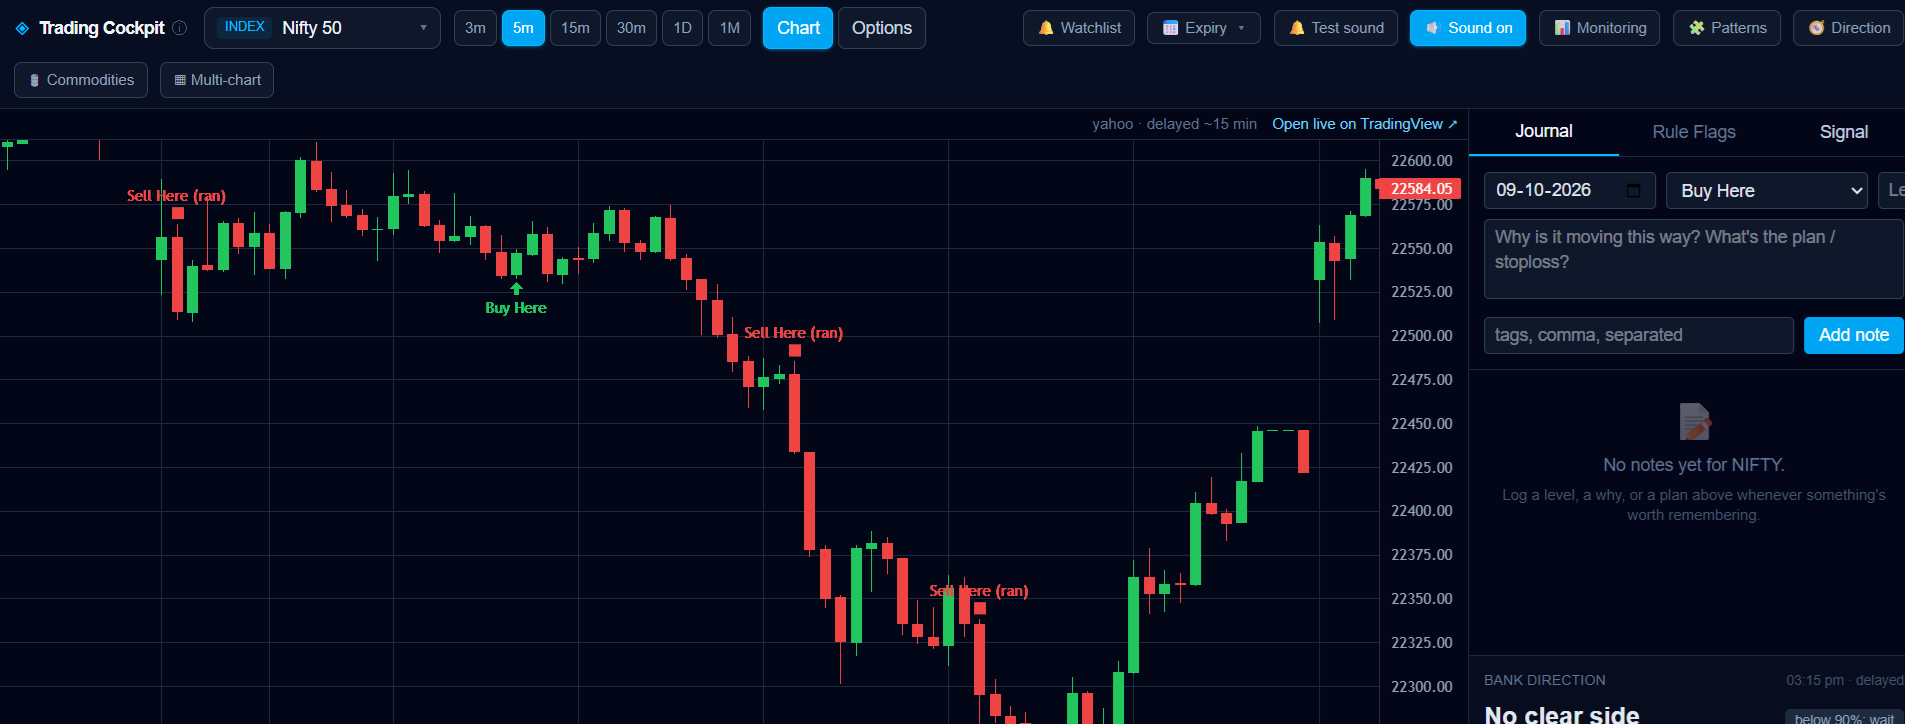
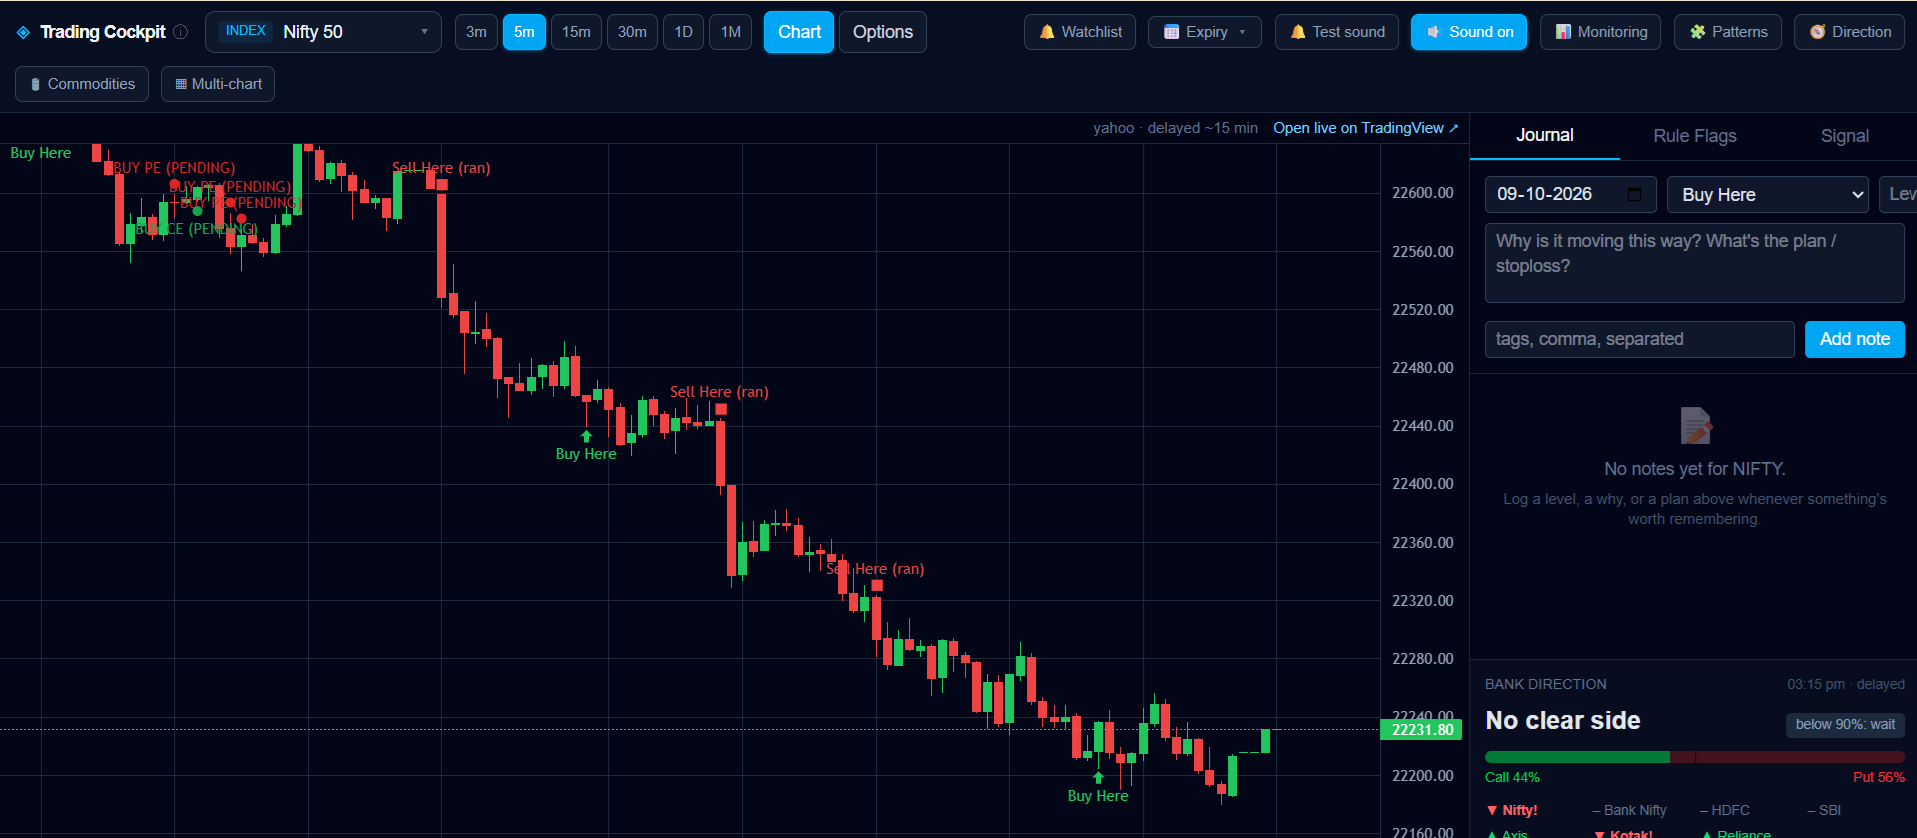
Nifty shows the same behaviour. In this screen Nifty fell nearly 300 points. Each time a support level broke and the fall kept going, the software placed another Sell Here mark. A Buy Here mark shows where buyers stepped in along the way.
One honest point: these marks are placed on candles that have already formed. They show you where the stop-loss hunts happened. They are a guide for reading the chart, not a promise about the next candle.
Buy Here and Sell Here across swings
Markets do not fall or rise in a straight line every day. On swing days the marks help you see who is in control. Green marks show where buyers took over, red marks show where sellers did.
The small circles in this screen are signals the software logged. Every signal is saved with what happened afterwards, and a results page shows the win rate by signal type. You can judge the software on its record, not on a few good screenshots.
The whole day, 5 minutes at a time
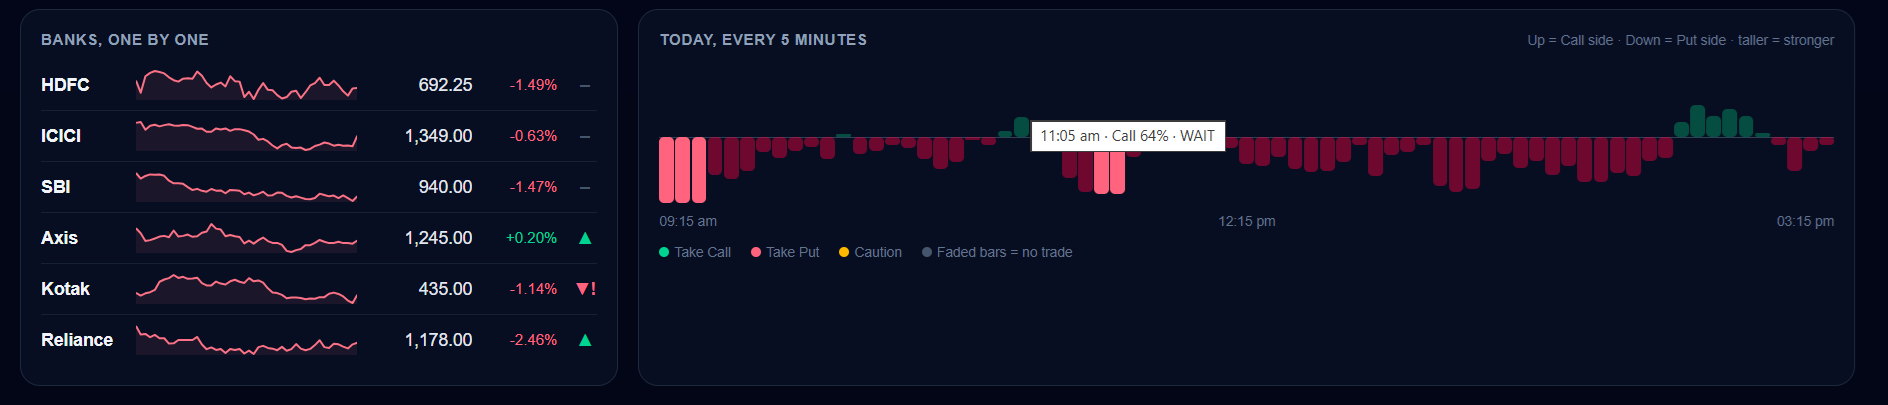
The dashboard also draws one bar for each 5-minute candle of the day. Bars above the line lean to the Call side, bars below lean to the Put side, and taller bars are stronger. The bright bars are the moments a trade was called.
Beside it, each bank is listed with its own direction. If HDFC and ICICI are falling while Axis is rising, you can see at once that the banks do not agree, and why the verdict is to wait.
Chart, journal and direction meter on one screen
The main screen is a clean candlestick chart with the marks, a trade journal and the Bank Direction meter. In the journal you write the level, the reason and the stop-loss for each idea. Reviewing your own notes later is one of the fastest ways to improve.
There is also a multi-chart screen that shows four or six markets together. When a signal appears it says the chart name out loud, for example “Bank Nifty. Buy here.”, so you do not have to stare at every chart.
Does it work for Bitcoin, Ethereum, Gold, Silver and Natural Gas?
Yes, with one clear difference. The charts, the Buy Here and Sell Here marks, the voice alerts and the multi-chart screen all work for Bitcoin, Ethereum, Gold, Silver, Natural Gas and Crude Oil.
Commodities also have their own dashboard. It shows the current-month and next-month futures side by side, the trend, the last-hour high and low, and where buyers and sellers stepped in. It marks the busiest hours too. In our data, 4 PM to 9 PM IST was the most active window for all four commodities.
The full Call / Put direction verdict is built for Nifty and Bank Nifty only, because it depends on the banks and India VIX. For crypto and commodities we tested several price-action rules and none of them predicted direction better than chance, so the software shows you the trend and levels and leaves the decision to you.
We removed the rules that failed
A pattern that looks convincing on a chart is not enough. Every rule is checked on months of real 5-minute data before the software is allowed to use it, and some popular ideas did not survive.
This is the main reason we trust what remains. The software is not a collection of every idea we liked. It is what was left after testing.
- Everything simply moving the same way: about 53% right, so it was not enough by itself
- Breaks of the day's high or low: no better than a coin flip, and worse late in the day
- Buyers at support and sellers at resistance as a trade trigger: about half right, so it is shown for information only
- Repeat signals on the same side later in the day: they lost points on average, so they do not alert
What it is, and what it is not
It is a decision-support tool. It watches nine charts so you do not miss a move, it tells you when conditions are strong, and it shows its past accuracy on screen. It runs on your own computer, and your trades and notes stay with you.
It is not a guarantee of profit, not a tips service, and not an auto-trading robot. Some alerts will be wrong. You place every trade yourself, and you still need a stop-loss and your own judgement.
On data: charts for Nifty, Bank Nifty, the banks, India VIX and crypto update within seconds of the market. Commodity futures charts can run a few minutes behind. The option chain works through your own Dhan account and needs Dhan's data plan.
OLI AI Labs is a software company, not a SEBI-registered investment adviser. Nothing here is investment advice. Trading options, futures and crypto carries a high risk of loss, and most intraday option traders lose money. Trade only with money you can afford to lose.
How to get it set up
You do not need to be technical. Our team shows you the software on a live call, installs it on your Windows or Mac computer, connects the data, turns on notifications and walks you through each screen.
If you trade Nifty or Bank Nifty options and want fewer, better trades, the next step is a demo.
Frequently asked questions
- How does the software decide between Call and Put?
- On each 5-minute candle it checks whether the big banks are moving in one direction, whether Nifty and Bank Nifty agree, whether the group is breaking its last-hour high or low together, and whether India VIX is moving the opposite way. It calls a side only when these line up.
- How accurate are the signals?
- In our test on 59 trading days, the high-probability alerts fired 38 times and Bank Nifty had moved in the called direction 30 minutes later in 74% of them. Other signals were right about 53% of the time. These are past test results on a small sample, live results can be lower, and no signal is guaranteed.
- Does it work for Bitcoin, Ethereum, Gold, Silver and Natural Gas?
- Charts, Buy Here and Sell Here marks, voice alerts and the multi-chart screen work for all of them, and commodities have their own futures dashboard. The full Call / Put direction verdict is built for Nifty and Bank Nifty only.
- Will your team help me install it?
- Yes. Our team installs the software on your Windows or Mac computer, connects the data, turns on notifications and trains you on each screen.
- Is this investment advice?
- No. It is an analysis and decision-support tool from a software company. It is not investment advice and does not guarantee profit. Trading carries a high risk of loss.
Want to see it on the markets you trade?
Our team will show you the software on a live call and help you set it up on your own computer: installation, data connection, alerts and training.
See the software and request a demo